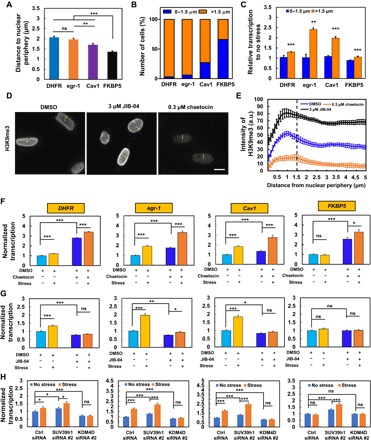
Fig. 4. Modulation of H3K9 methylation alters gene transcription responses to force.

(A) Distances of various gene transcripts to nuclear periphery. n = 68, 66, 65, and 67 cells. For multiple DHFR gene transcripts within one cell, the distances were averaged. (B) Most FKBP5 transcripts are located within 0 to 1.5 μm from the nuclear periphery, and most DHFR, egr-1, and Cav1 transcripts are located >1.5 μm. (C) Quantification of gene transcription by RNA FISH after stress application (15 Pa at 0.3 Hz for 2 min for DHFR and egr-1; 10 min for Cav1 and FKBP5); n = 7 and n = 217 for DHFR at 0 to 1.5 μm and >1.5 μm; n = 8 and n = 131 for egr-1 at 0 to 1.5 μm and >1.5 μm; n = 23 and n = 69 for Cav1 at 0 to 1.5 μm and >1.5 μm; n = 147 and n = 77 for FKBP5 at 0 to 1.5 μm and >1.5 μm. (D) Representative immunofluorescence images of H3K9me3 when treated with 0.1% dimethyl sulfoxide (DMSO), 3 μM JIB-04 [a H3K9 demethylase inhibitor; H3K9 demethylase activity is decreased (34) by ~50% at 2 μM], or 0.3 μM chaetocin for 4 hours [H3K9me3 inhibitor; this dose was chosen because at 0.1 μM, the drug induced FKBP5 up-regulation (fig. S5)]. Scale bar, 10 μm. (E) Quantification analysis of H3K9me3 fluorescence intensities along the yellow line in (D), starting from the nuclear periphery in each cell after treatment with 0.1% DMSO, 3 μM JIB-04, or 0.3 μM chaetocin for 4 hours. n = 60 cells in each group. (F to H) Modulation of H3K9me3 levels in CHO cells with chaetocin (F) (0.3 μM for 4 hours), JIB-04 (G) (3 μM for 4 hours), SUV39h1 siRNA #2, or KDM4D siRNA #2 (H) regulates force-induced up-regulation of gene transcription. For RNA FISH detection of transcription of DHFR (2-min stress, 5′-probe), egr-1 (2-min stress), Cav1 (10-min stress), and FKBP5 (10-min stress), cells were stressed by 15 Pa at 0.3 Hz. For (F), n = 84, 154, 56, and 116 for DHFR; n = 79, 64, 115, and 91 for egr-1; n = 68, 42, 85, and 34 for Cav1; n = 46, 68, 34, and 63 for FKBP5. For (G), n = 67, 96, 92, and 84 for DHFR; n = 77, 59, 105, and 83 for egr-1; n = 68, 42, 72, and 56 for Cav1; n = 65, 50, 73, and 52 for FKBP5. For (H), n = 101, 77, 63, 80, 80, and 112 for DHFR; n = 59, 62, 52, 52, 64, and 52 for egr-1; n = 53, 50, 52, 50, 51, and 56 for Cav1; n = 58, 63, 54, 59, 52, and 61 for FKBP5. For each subfigure, mean ± SEM; ns, not statistically significant; *P < 0.05, **P < 0.01, ***P < 0.001; one-way ANOVA with Bonferroni multiple comparison tests when appropriate. a.u., arbitrary units.
