
Fig. 5.
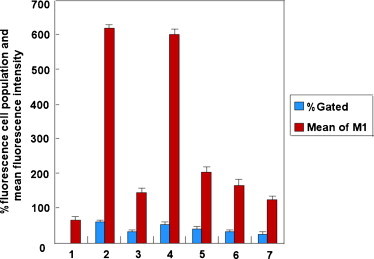
Flow cytometry analysis of M-EGFP expression in HEK 293T cells. Lanes (1–7) show the results from HEK 293T cells control, cells transfected with pEGFP-M, cells co-transfected with pEGFP-M and EGFP siRNA, cells co-transfected with pEGFP-M and scramble siRNA, cells co-transfected with pEGFP-M and M-siRNA1, cells co-transfected with pEGFP-M and M-siRNA2 and cells co-transfected with pEGFP-M and M-siRNA3, respectively. At 48 h after transfection, cells were analyzed for EGFP expression by flow cytometry. The percentage of the cell population that exceeded the fluorescence intensity of the control cells and the mean fluorescence intensity of this population were calculated. The results represent the means of three independent experiments.