
Fig. 2. MeV droplets exhibit liquid-like behavior.
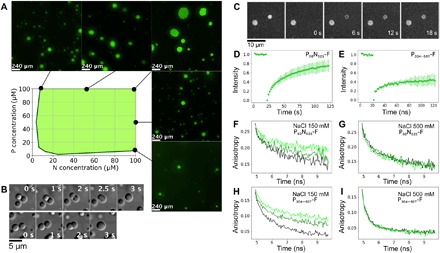
(A) Turbidity-based phase diagram as a function of P50N525 and P304–507 concentrations. Green shading represents ranges of combinations of protein concentration that form droplets. Examples of fluorescent images at several N and P concentrations that show phase separation are presented around the phase diagram. (B) Fusion events followed by relaxation into spherical droplets in a mixture comprising P304–507 (100 μM) and P50N525 (10 μM). (C) Images of FRAP shows exchange of P50N525–fluorescein amidite between phases. (D) FRAP kinetics of P50N525 (25 μM with 10 nM P50N525-fluorescein) in droplets formed with P304–507 at 1:2 ratio. (E) FRAP kinetics of P304–507 (50 μM with 50 nM P304–507-fluorescein) in droplets formed with P50N525 at 2:1 ratio. (F and G) Fluorescence anisotropy of P50N525-fluorescein (10 μM P50N525, 500 nM P50N525-fluorescein) in the dilute phase (black) and in the presence of P304–507 under phase-separating conditions [N:P = 1:2 (dark green) and N:P = 1:4 (light green)]. Fluorescence lifetimes were measured at room temperature, (F) in buffer containing 150 mM NaCl and (G) in buffer containing 500 mM NaCl that suppresses phase separation but not the interaction between proteins. (H and I) Fluorescence anisotropy of P304–507-fluorescein (10 μM, 500 nM P304–507-fluorescein) in the dilute phase (black) and in the presence of P50N525 at phase-separating conditions [P:N = 4:1 (dark green) and P:N 2:1 (light green)]. Fluorescence lifetimes were measured at room temperature, (H) in buffer containing 150 mM NaCl and (I) in buffer containing 500 mM NaCl that suppresses phase separation but not the interaction between proteins.