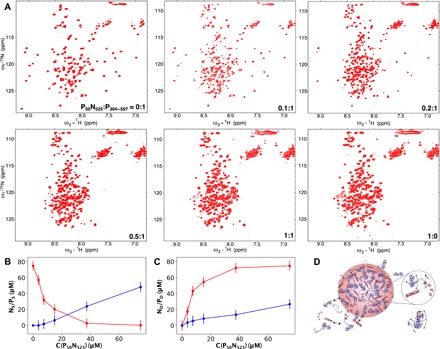
Fig. 5. Thermodynamics of MeV NP phase separation.

(A) 1H-15N HSQC of 15N-labeled P50N525 and P304–507 at different admixtures of the two proteins; all spectra were recorded at 850 MHz, 25°C. P304–507 concentration was 75 μM, and P50N525 concentration varies from 5 to 100% of 75 μM. (B) Concentration of P50N525 and P304–507 proteins in the dilute phase derived from the spectra shown in (A). (C) Comparison of concentrations of droplet-associated P50N525 and P304–507 in the sensitive volume, estimated on the basis of observation of protein in the dilute phase [derived from analysis of spectra shown in (A)]. Total concentration of P in the mixture was 75 μM. (D) Schematic representation of droplet formation upon mixing P50N525 and P304–507.
