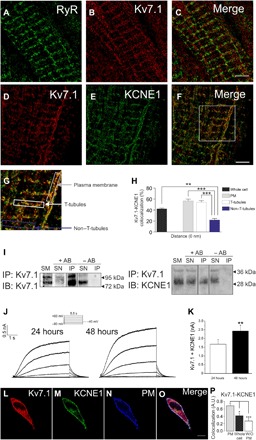
Fig. 1. Kv7.1 and KCNE1 recapitulate cardiac IKs currents and associate in T-tubules in cardiomyocytes.

(A to H) dSTORM in rat ventricular cardiomyocytes. Fluorophore-coupled antibodies were used to stain native proteins. (A) Staining for RyR in cardiac T-tubules. (B) Kv7.1 (red) and (C) merge image. (D to F) Staining for Kv7.1 and KCNE1 in cardiac T-tubules. (D) Kv7.1, red; (E) KCNE1, green; (F) colocalization of Kv7.1 and KCNE1, yellow. Scale bars, 5 μm. (G) Magnified area from the square in (F). The insets delineate the representative regions of interest analyzed in (H). (H) Kv7.1-KCNE1 colocalization at a 0-nm distance determined by dSTORM analysis. Color code in (G) and (H): gray, PM; white, T-tubules; blue, nontubule area excluding the previous structures. The black bar represents whole-cell colocalization. Statistical analysis determined a P < 0.001 by analysis of variance (ANOVA) with a Tukey post hoc test. **P < 0.01 and ***P < 0.001 (insets, n > 10 from five independent cells). (I) Kv7.1 coimmunoprecipitates with KCNE1 in rat cardiac samples. Total crude protein extracts from rat ventricular cardiomyocytes were immunoprecipitated (IP) with anti-Kv7.1 antibodies and immunoblotted (IB) against Kv7.1 (left) and KCNE1 (right). SM, starting material; SN, supernatant; +AB, presence of antibodies; −AB, absence of antibodies during the immunoprecipitation. (J) Coexpression of Kv7.1 and KCNE1 in COS-7 cells recapitulates IKs currents. COS-7 cells were cotransfected with Kv7.1 and KCNE1 for 24 and 48 hours. The cells were held at −40 mV, and 5.5-s depolarizing pulses was applied from −80 to +60 mV. (K) Maximal intensity of currents at +60 mV. White bar, cells transfected for 24 hours; black bar, currents recorded after 48 hours of expression. The values are the means ± SEM of six to eight cells. **P < 0.01 versus 24 hours, Student’s t test. (L to P) Expression of Kv7.1 and KCNE1 in HEK-293 cells. Cells were cotransfected with Kv7.1-CFP and KCNE1-YFP for 48 hours, and representative confocal images were acquired. (L) Kv7.1, red; (M) KCNE1, green; (N) PM marker, blue; (O) merged signals. White represents triple colocalization. Scale bar, 10 μm. (P) Cellular colocalization of Kv7.1-CFP and KCNE1-YFP. The PM staining was used to create a mask to analyze the Kv7.1-KCNE1 colocalization. Whole cell, the entire cell was analyzed. Without (W/O) PM, whole-cell colocalization values were subtracted from those at the PM. The values are the means ± SEM of >25 cells. *P < 0.05 and ***P < 0.01 versus PM, Student’s t test. A.U., arbitrary units.
