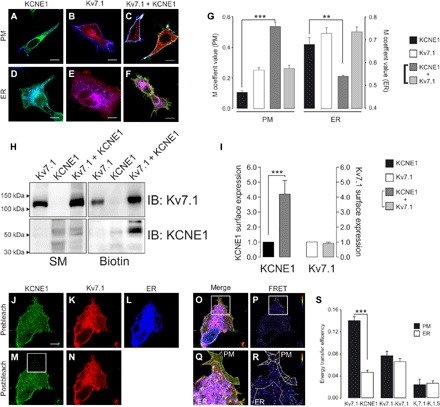
Fig. 3. Kv7.1-KCNE1 assembly within the secretory pathway.

(A to F) Representative images of KCNE1-YFP (A, green), Kv7.1-CFP (B, red), and KCNE1-YFP + Kv7.1-CFP (C, green and red) coexpressed with Akt-PH-pDsRed (A to C, PM marker in blue) and ER-DsRed (D to F, blue) in HEK-293 cells. PH, pleckstrin homology. (A and D) Cyan shows colocalization between green and blue. (B and E) Magenta shows colocalization between red and blue. (C and F) Yellow shows partial colocalization between green and red. White shows triple colocalization between green, red, and blue. Scale bar, 10 μm. (G) M coefficient analysis of KCNE1 (black), Kv7.1 (white), and Kv7.1 + KCNE1 (light and dark gray) overlapping the ER and membrane (PM) markers. The bars represent the means ± SEM. **P < 0.01 and ***P < 0.001 for KCNE1 in the absence of Kv7.1 versus KCNE1 in the presence of Kv7.1 (n = 19 to 40, Student’s t test). (H) Biotin assay of KCNE1 and Kv7.1 cell surface expression. HEK-293 cells were transfected with Kv7.1-CFP, KCNE1-YFP, and Kv7.1-CFP + KCNE1-YFP. After transfection, the cells were labeled with biotin and processed as described in Materials and Methods. Western blot analysis was performed with anti-Kv7.1 (IB: Kv7.1) and anti-KCNE1 (IB: KCNE1) antibodies. Biotin, biotinylated pull down proteins. (I) Densitometric analysis of biotinylated Kv7.1 and KCNE1. KCNE1 (black), Kv7.1 (white), and Kv7.1 + KCNE1 (light and dark gray, respectively). The bars represent the means ± SEM. ***P < 0.001 for KCNE1 in the absence of Kv7.1 versus KCNE1 in the presence of Kv7.1 (n = 3, Student’s t test). (J to R) Representative results of Kv7.1-CFP and KCNE1-YFP FRET experiments in ER-containing CUPs (mCUPs). (J to L) Prebleaching images of KCNE1-YFP (J), Kv7.1-CFP (K), and ER-DsRed (L). (M and N) Postbleaching images of KCNE1-YFP (M) and Kv7.1-CFP (N). The bleached area is highlighted with a white square. (O) Merged prebleaching image (J to L). (Q) Magnified view of the bleached area in the merged image that enables the PM to be distinguished from the ER. (P and R) FRET ratio images. The calibration bar ranges from 0.8 (blue) to 1.4 (red). Scale bar, 10 μm. (S) FRET was measured independently in the PM (black bars) and the ER (white bars) within the same cell. The values indicate the means ± SEM. ***P < 0.001 for Kv7.1-KCNE1 in the PM versus the ER (n = 40, Student’s t test).
