
Fig. 6. ER-PM junctions are platforms for Kv7.1-KCNE1 complex assembly.
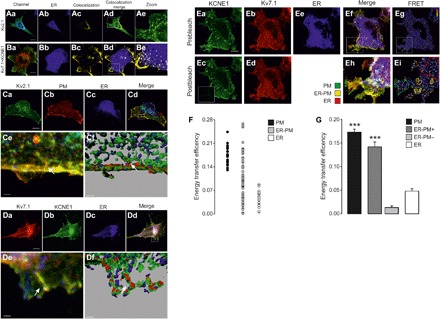
HEK-293 cells were transfected with Kv2.1-YFP and Kv7.1-CFP + KCNE1-YFP and with ER-DsRed and Akt-PH-pDsRed as ER and PM markers, respectively. (Aa to Ae) Kv2.1 colocalization with the ER compartment. (Aa) Merged image of Kv2.1-YFP (green) and ER-DsRed (blue) staining. Cyan, colocalization. (Ab) ER-DsRed. (Ac) Mask of the subcellular distribution of the Kv2.1-ER colocalization signal. (Ad) Merge image of Aa and Ac. (Ae) Magnified view [white rectangle in (Ad)]. (Ba to Be) Kv7.1 and KCNE1 subunits colocalize at discrete sites in distal ER domains. (Ba) Kv7.1-CFP (red) and KCNE1-YFP (green) coexpression. Yellow, colocalization. (Bb) ER-DsRed expression is shown in blue. (Bc) Mask of the subcellular distribution of the Kv7.1-KCNE1 colocalization signal. (Bd) Merge of the images in Bb and Bc. (Be) Magnified view [white rectangle in (Bd)]. Kv7.1-KCNE1 colocalized with the ER marker (white) in discrete areas juxtaposed with the PM. Scale bars, 10 μm. (Ca to Cf) Kv2.1 localization at ER-PM junctions in 3D surface renders. (Ca to Cd) Maximal projection of the z stack of the whole-cell volume. (Ca) Kv2.1-YFP, green; (Cb) PM, red; (Cc) ER, blue; (Cd) Merged image. Scale bars, 10 μm. The white rectangle indicates the magnified area in (Ce) and (Cf). White, triple colocalization. The arrows indicate Kv2.1 at ER-PM junctions. (Cf) 3D surface render. ER, blue; PM, red; Kv2.1, green. The white arrow points to an ER-PM contact site where Kv2.1 is localized. Scale bar, 1.5 μm. (Da to Df) Kv7.1-KCNE1 complexes localized at ER-PM junctions in 3D surface renders. (Da to Dd) Maximal projection of the z stack of the whole-cell volume. (Da) Kv7.1-CFP, red; (Db) KCNE1-YFP, green; (Dc) ER, blue; (Dd) merge. Scale bars, 10 μm. The white rectangle indicates the magnified area in (De) and (Df). (De) White, triple colocalization. The arrows highlight Kv7.1-KCNE1 at ER-PM junctions. (Df) 3D surface render. ER, blue; Kv7.1, red; KCNE1, green. The white arrow points to a Kv7.1-KCNE1 complex localized at a cortical ER projection juxtaposed with the PM. Scale bar, 2 μm. (Ea to Ei) Results of FRET experiments between Kv7.1-CFP and KCNE1-YFP in mCUPs. (Ea and Eb) Prebleaching images showing KCNE1-YFP in green (Ea) and Kv7.1-CFP in red (Eb). (Ec and Ed) Postbleaching images of KCNE1-YFP (Ec) and Kv7.1-CFP (Ed). The bleached area is highlighted with a white square. (Ee) ER-DsRed, blue. (Ef) Merged image of (Ea) to (Ee). (Eh) Magnified view of the bleached area in the merged image that enables the PM (green line) to be distinguished from the ER (red line). Kv7.1 and KCNE1 were highly colocalized in discrete ER-related structures identified as ER-PM junctions (yellow line). (Eg and Ei) Original and magnified FRET ratio images, respectively. The calibration bars range from 0.8 (blue) to 1.4 (red). Scale bar, 10 μm. (F) Plot of individual FRET measurements in the PM (black), ER-PM junctions (gray), and the ER (white) in mCUPs. (G) FRET measurements in the PM (black), positive ER-PM junctions (+, dark gray), negative ER-PM junctions (−, light gray), and the ER (white) within the same cell. The bars represent the means ± SEM (n = 20 to 38). ***P < 0.001 for Kv7.1-KCNE1 in ER-PM+ versus the ER (n = 20 to 38, Student’s t test).