. 2020 Mar 18;9:e52779. doi: 10.7554/eLife.52779

Figure 2. Loss of Piezo1 or both Piezo1/2 in embryonic limb mesenchyme led to reduced bone formation and spontaneous bone fractures in neonatal mice.

(a) Whole mount alizarin red and alcian blue staining of P0 mouse pups from the same litter. Bone fractures were indicated by arrows. The forelimb (FL) and hindlimb (HL) were taken out and shown in the lower panel. (b) Representative three dimensional μCT images of humerus from 3 weeks old littermate mice with the indicated genotypes. The humerus length was quantified (n = 6, mean ± SD). Bone fracture is indicated by an arrow. (c) Representative cross section μCT images of the cortical and trabecular femur bones from 3 weeks old littermate mice. (d) Quantified analysis of μCT data. Data are shown as means ± SD. (e, f) Histomorphometric analysis of distal femurs from wild type and Prrx-Cre driven Piezo1 CKO and Piezo1/2 DKO mutant mice. Representative images of double Calcein labeling in the cortical (e) and trabecular (f) bones were showed, and the dynamic bone formation parameters were only quantifiable in the wild type and Piezo1 CKO group, due to the severely reduced cortical bone formation in the Piezo1/2 DKO and little bone formation in the secondary spongiosa of the distal metaphysis in both Piezo1 CKO and Piezo1/2 DKO mutant mice. PO: periosteum; EO; endosteum. Scale bars: 50 μm (e); 100 μm (f). *p<0.05, **p<0.01, ***p<0.001, one-way ANOVA followed by Tukey’s multiple comparisons tests. In (e), p value is calculated by two-tailed unpaired Student’s t-test (Source data 1).

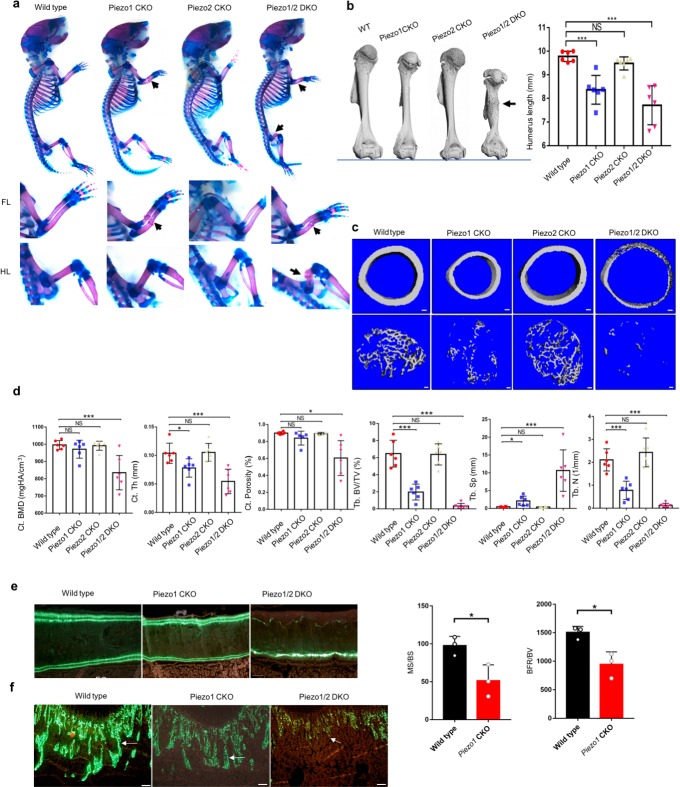
Figure 2—source data 1. Loss of Piezo1 or both Piezo1/2 in embryonic limb mesenchyme led to reduced cartilage growth and osteoblast differentiation.

Figure 2.

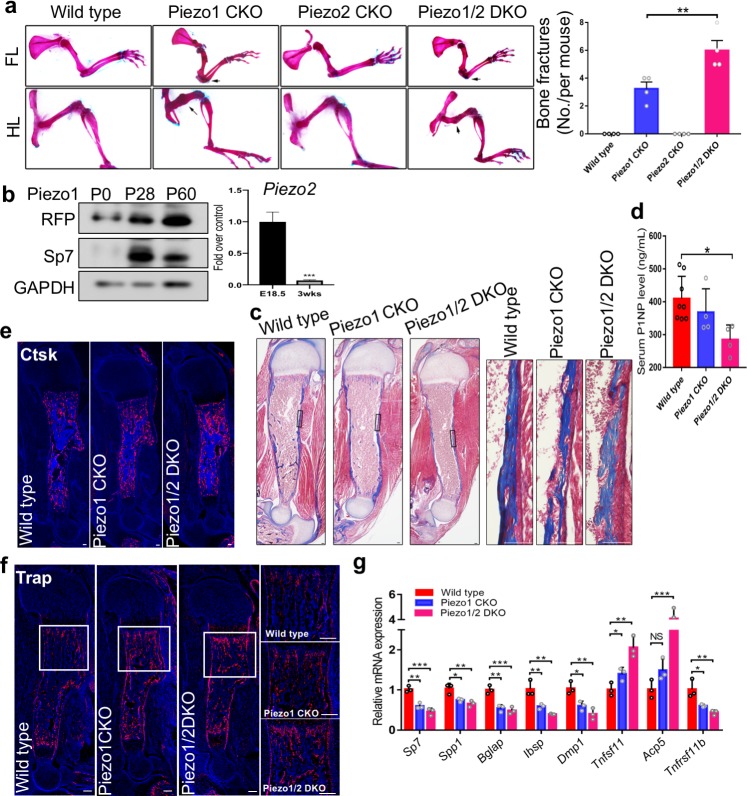
Figure 2—figure supplement 1. Gross characterization of Prrx1-Cre driven Piezo1 and Piezo2 mutant phenotypes at postnatal stages.

Figure 2—figure supplement 1.

(a) Representative images of alizarin red and alcian blue stained limbs from 3 weeks old mice with the indicated genotypes. Bone fractures are indicated with arrows and quantification (n = 4) is shown on the right side. (b) Expression of Pieozo 1 and 2. Western blotting analysis of the humerus bone devoid marrow from the Piezo1-Tdtomato mice of the indicated ages. Piezo1 protein levels were shown by RFP immunoblotting. Piezo2 protein was too low to be detected. RT-qPCR analysis of Piezo2 expression of cortical bones from E18.5 and 3 weeks old mice was performed. n = 5–6. (c) Masson’s Trichrome staining of humerus sections from P5 mouse pups. Reduction in collagen content (blue staining) was observed in the Piezo1 CKO or Piezo1/2 DKO mutants. Boxed regions are shown in higher magnification in the right panel. (d) Detection of serum PINP levels in the 4 weeks old mice with the indicated genotypes by ELISA. Bone formation was most significantly reduced in the Piezo1/2 DKO mutant. (n = 4–7, means ± SD). (e, f) Immunostaining of Ctsk (e) and Trap1 (f) in humerus sections from P0 mouse pups. Boxed regions were shown in higher magnification in the right panel. Osteoclast differentiation was increased in both Piezo1 CKO and Piezo1/2 DKO mutants. (g) qPCR analysis of osteoblast and osteoclast gene expression from bone tissues of P0 pups with indicated genotypes (n = 3, means ± SD). *p<0.05, **p<0.01, ***p<0.001, two-tailed unpaired Student’s t-test or one-way ANOVA followed by Tukey’s multiple comparisons tests when ANOVA was significant (a, d and g) (Figure 2—figure supplement 1—source data 1).
Figure 2—figure supplement 1—source data 1. Original numbers used for quantification and Western blots.