. 2020 Mar 18;9:e52779. doi: 10.7554/eLife.52779

Figure 9. Concerted activation of NFATc1, Yap1 and Ctnnb1 by Piezo channel activation.

(a) Western blotting analysis of NFATc1 expression in bone tissue lysates from P0 pups. The slower migrating phosphorylated NFATc1 forms were indicated by blue arrows. (b) Luciferase reporter assays of NFATc1 (left), YAP1 (middle) and Ctnnb1 (right) activities in HEK293T cells (n = 3, means ± SD). *p<0.05, **p<0.01, ***p<0.001, two-tailed unpaired Student’s t-test and one-way ANOVA followed by Tukey’s multiple comparisons tests when ANOVA was significant (Figure 9—source data 1). Yoda1 treatment promoted transcription activities of NFATc1, YAP1 and Ctnnb1, which were abolished by PIEZO1 knocking down. (c) Immunoprecipitation (IP) assays of HEK293T cell lysates with the indicated expression constructs. Shaking promoted NFATc1 and YAP1 binding. (d, e) Immunostaining of YAP1 and NFATc1 in HEK293 cells with indicated treatments. Activation of PIEZO1 with Yoda1 or FSS through shaking promoted nuclear localization of both YAP1 and NFATc1, which was blocked by Gd3+ or CsA treatment. Scale bars, 100 μm. (f) Western blotting analyses of Yoda1 treated primary mouse BMSCs. Phosphorylated Ctnnb1 and Yap1 were quickly reduced. (g) IP assays of Ppp3ca binding to NFATc1, Yap1 and Ctnnb1 in mouse primary BMSCs. IP with IgG was a negative control. Yoda1 treatment promoted CnA binding to NFATc1, Yap1 and Ctnnb1, which was inhibited by CsA.

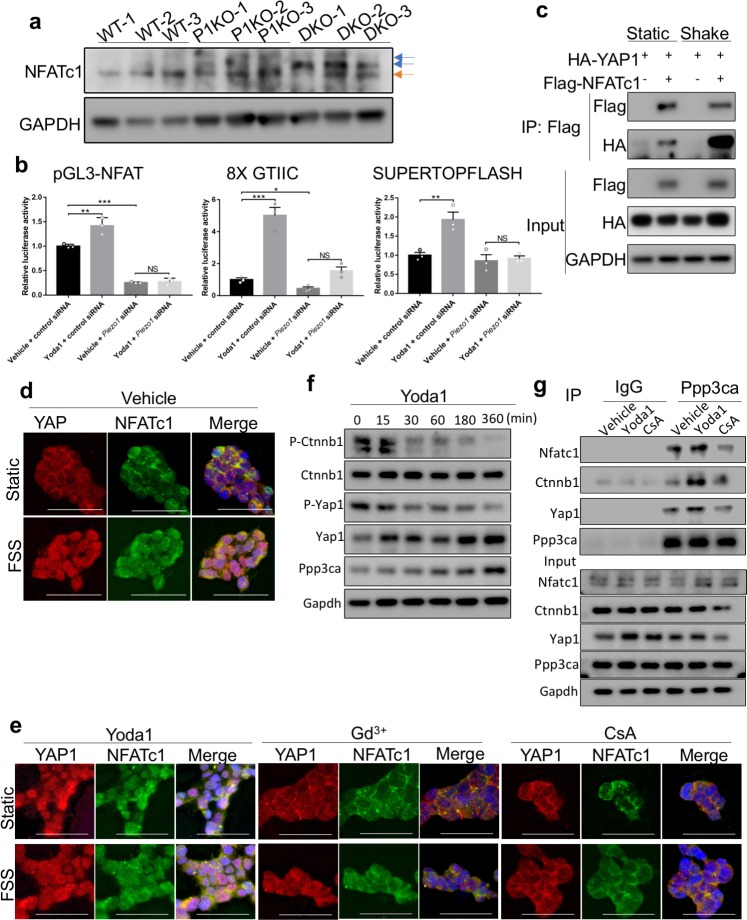
Figure 9—source data 1. Original Western blots and data for quantification.

Figure 9.

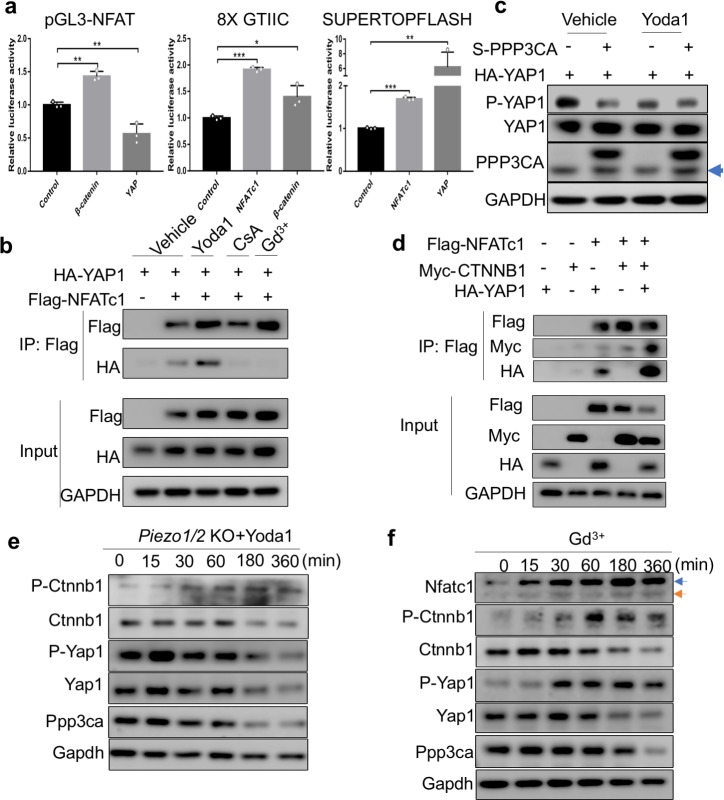
Figure 9—figure supplement 1. PIEZO1 activation led to concerted activation of NFATc1, YAP1 and CTNNB1.

Figure 9—figure supplement 1.

(a) Luciferase reporter assays of NFATc1 (pGL3-NFAT), YAP1 (8XGTIIC) and CTNNB1 (SUPERTOPFLASH) transcription activities in HEK293T cells. N = 3, data are shown as means ± SD. *p<0.05, **p<0.01, ***p<0.001, two-tailed unpaired Student’s t-test and one-way ANOVA followed by Tukey’s multiple comparisons tests when ANOVA was significant (Figure 9—figure supplement 1—source data 1). Expression one of NFATc1, YAP1 and CTNNB1 led to activation of the other two. The only exception is that YAP1 overexpression reducd NFATc1 activties. (b, d) Immunoprecipitation (IP) assays of HEK293T cell lysates with the indicated expression constructs. (b) Yoda1 treatment (40 μM, 4 hr) promoted complex formation of NFATc1 and YAP1, which was inhibited by CsA or Gd3+ treatment. (c) Western blotting assay of HEK 293 T cells transfected with HA-tagged YAP1 and S-tagged PPP3CA as indicated. DMSO (vehicle) or Yoda1 (40 μM) treatment was performed 24 hr after transfection for 4 hr. Arrow indicates endogenous PPP3CA. (d) Expression of NFATc1, YAP1 and CTNNB1 together promoted their complex formation. (e) Western blotting analyses of Piezo1/2 deficient BMSCs treated with Yoda1. Yoda1 treatment failed to reduce phosphorylation of Ctnnb1 and Yap1. Ppp3ca: Catalytic subunit of CaN. (f) Western blotting analyses of wild-type primary BMSCs treated by Gd3+. Increased Nfatc1 phosphorylation (blue arrow), as well as increased phosphorylation of Yap1 and Ctnnb1 was observed (Figure 9—figure supplement 1—source data 1).
Figure 9—figure supplement 1—source data 1. Original Western blots.