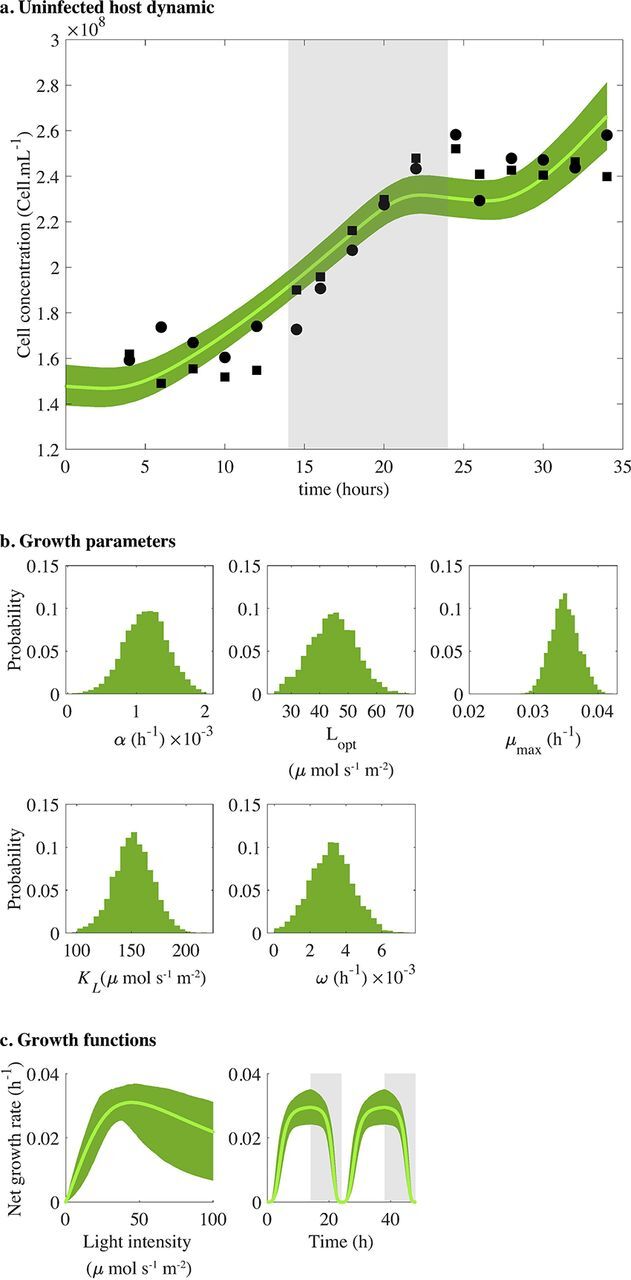
FIG 2.

Modeling Prochlorococcus MED4 strain as function of light without viruses during the exponential phase. (a) Fit of the host dynamic (equation 1). Solid lines represent the median of 5,000 model simulations, and shaded areas are the 95% quantiles. Black dots are data (from reference 45) for two replicates, and gray shaded area represents the dark condition. (b) Model growth parameter distributions of the host model (equations 1 and 4). Parameter distribution estimated using an MCMC algorithm: photosynthesis-irradiance (PI)-curve slope of the linear phase α, optimal growth light Lopt, maximal growth rate μmax, minimum amount of light necessary to divide KL, and natural mortality ω. (c) Model growth functions that drive the host dynamic: growth is expressed as the net growth rate (μopt − ω) as a function of irradiance (equation 4; left) and as a function of time (equation 2; right).
