
FIG 3.
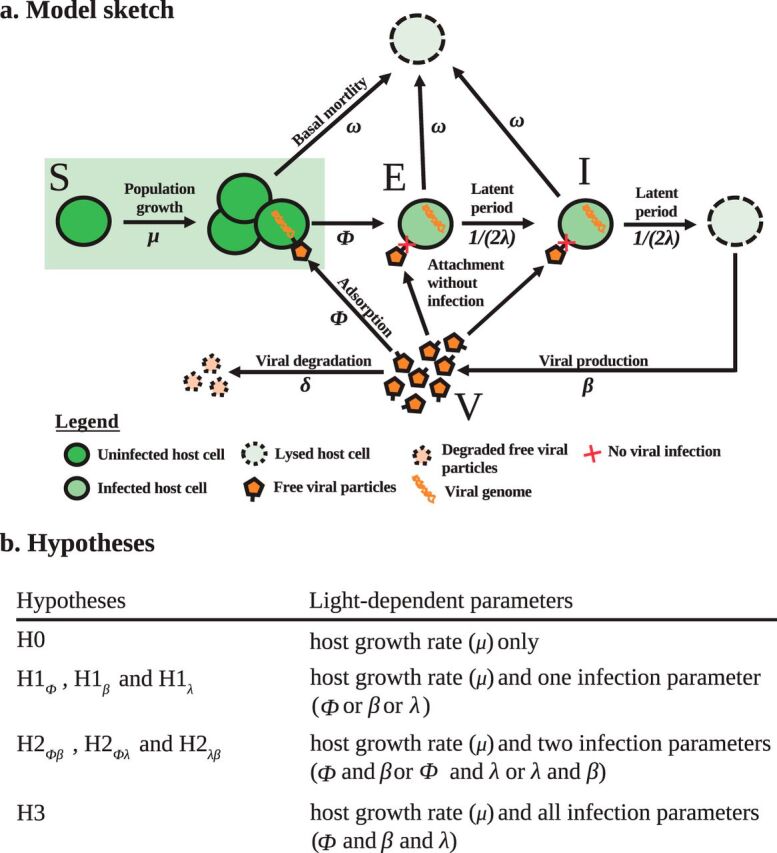
Description of the model. (a) Schematic representation of the model. The host population is divided into 3 classes: susceptible (S), exposed (E), and infected (I) types. The virus particle density is denoted by V. Black arrows are biological processes. (b) Definitions of the hypotheses. Each hypothesis describes a possible relation between light and the infection parameters. When parameter ϕ, β, or λ is light dependent, it is a piecewise function, i.e., it takes one value in light and one value in dark.