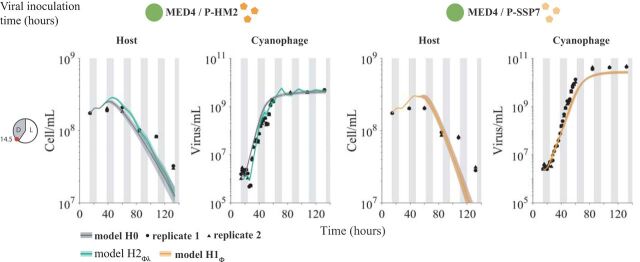
FIG 4.
Light-driven models fit to host and virus population abundance data. Model fits under H0 and hypotheses H2ϕλ and H1ϕ for an inoculation time of 14.5 h after the beginning of the experiment. Phage P-HM2 infecting strain MED4 (left) and P-SSP7 infecting MED4 (right). Solid lines represent the median values of 5,000 model simulations, with shaded areas the 95% quantiles. Data are represented by the black dots for two replicates. Vertical shaded gray lines represent dark conditions.

