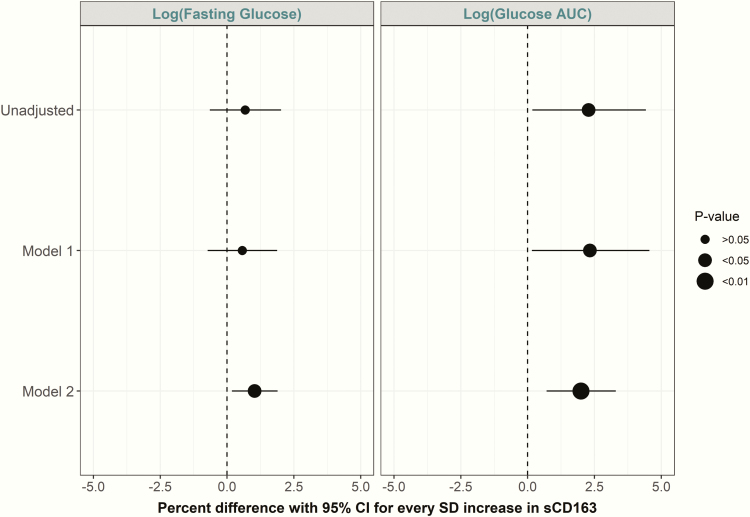
Figure 2.
Parameter estimates (with 95% CI) from GEE models showing associations of sCD163 with fasting glucose and glucose AUC (% difference in the outcome per SD increase in sCD163). Model 1: adjusted for years from baseline (time), baseline age, sex, and ethnicity. Model 2: Model 1 plus physical activity, smoking, blood pressure, and waist circumference.

