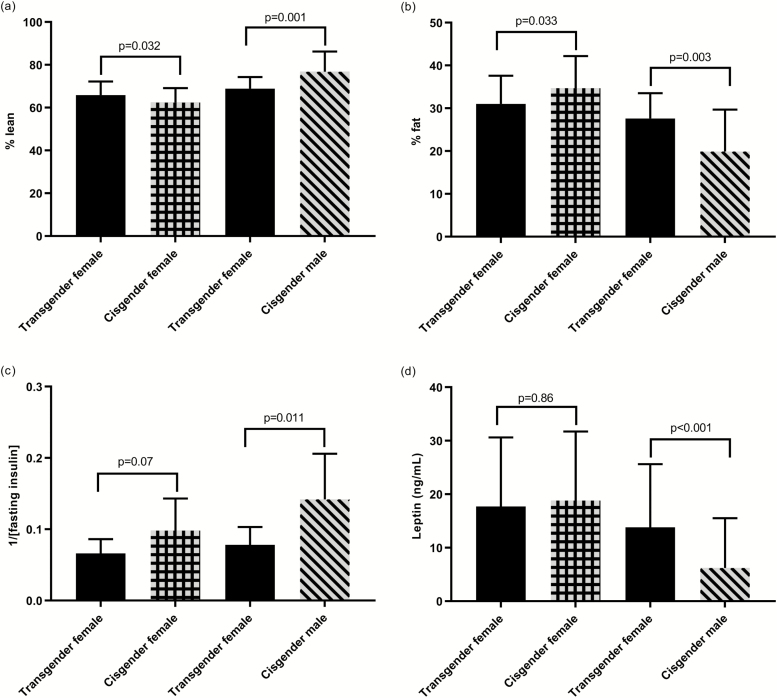
Figure 2.
Body composition, insulin sensitivity, and leptin in transgender females and cisgender males and females. Means and SD are presented. Transgender females are presented twice because not all the same individuals are compared with both cisgender males and females (10 are in both comparisons).

