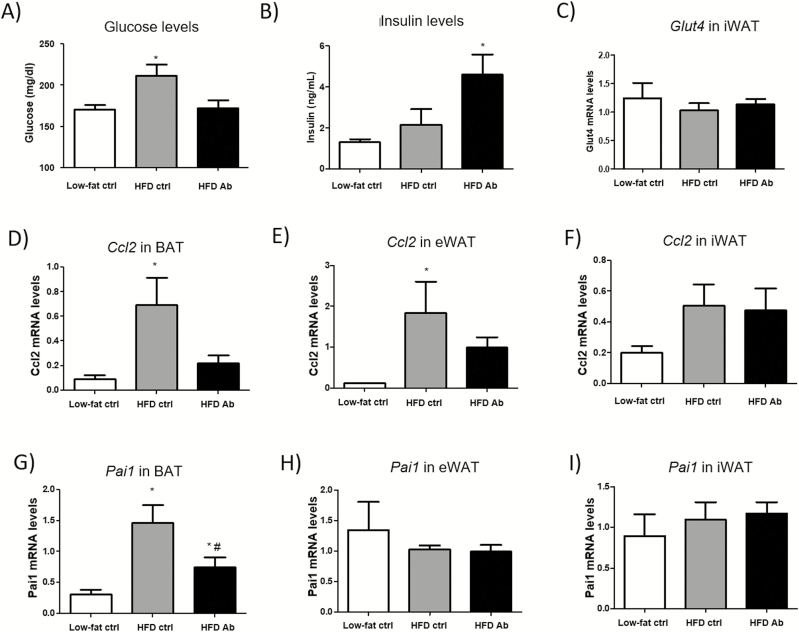
Figure 5.
OSM immunoneutralization decreases Ccl2 expression in WAT and BAT and normalizes glucose levels. Glucose (A) and insulin (B) levels in random fed animals. Glut4 mRNA levels in iWAT (C). Relative mRNA levels of Ccl2 (D, E, F) and Pai1 (G, H, I) in WAT and BAT. The 3 groups correspond to mice fed low-fat control diet (control diet), mice fed a HFD and treated with unspecific IgG (HFD control), and mice fed a HFD and treated with anti-OSM Ab (HFD Ab). Data are presented in arbitrary units as means ± standard error of the mean (n = 6 mice per group and analytical assays performed in triplicate). *P < .05 vs control diet.

