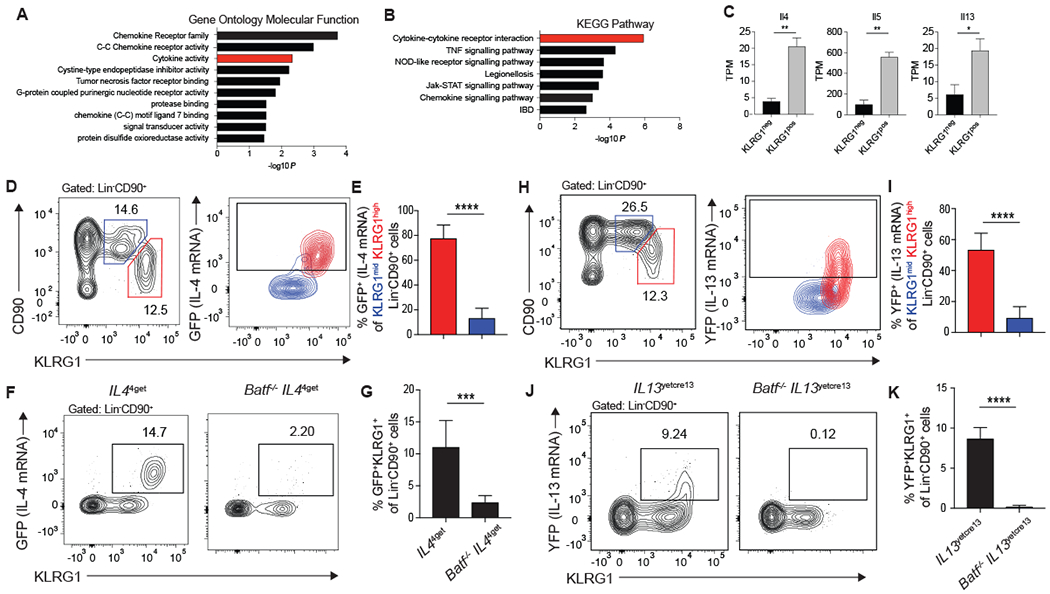
Figure 5: KLRG1high iILC2s are responsible for type-2 cytokine production in the lung 5 days after N. brasiliensis infection.

(A-C) RNA sequencing was performed on KLRG1pos and KLRG1neg Lin−CD90+ lung cells from mice treated with IL-33 as described in Figure 1. (A-B) Genes that are significantly different and increased at least two-fold in KLRG1pos relative to KLRG1neg cells were used in (A) Gene Ontology Molecular Function analysis and (B) KEGG Pathway analysis. Results are shown as -log10P values to denote pathways that are significantly associated with genes upregulated in KLRG1high ILC2s. Activity groups or pathways that relate to cytokine signaling are highlighted in red. (C) Quantification of type-2 cytokine expression in KLRG1pos and KLRG1neg populations. (D-G) IL44get and Batf−/−IL44get and (H-K) IL13yetcre13 and Batf−/−IL13yetcre13 mice were infected with N. brasiliensis and pulmonary Lin−CD90+ ILC2s were assessed 5 days later by flow cytometry. (D, H) Contour plot showing IL-4 (GFP) (D) or IL-13 (YFP) (H) cytokine reporter expression of KLRG1mid (blue) and KLRG1high (red) ILC2s. Gates were set according to a reporter negative control. (E, I) Bar graphs comparing the percent of KLRG1mid and KLRG1high ILC2s that express either IL-4 (GFP) with n=8 mice combined from 3 separate experiments (E) or IL-13 (YFP) with n=9-10 mice combined from 4 experiments (I). (F, J) Representative contour plots of IL-4 (GFP) (F) or IL-13 (YFP) (J) and KLRG1 expression on Lin−CD90+ lung ILC2s. (G, K) Bar graphs comparing the percent of KLRG1+ ILCs expressing IL-4 (GFP) with n=6-8 mice combined from 3 separate experiments (G) or IL-13 (YFP) with n=6-7mice combined from 3 separate experiments (K). *p≤0.05, **p≤0.01, ***p≤0.001, ****p≤0.0001 as determined by two-tailed unpaired t test.
