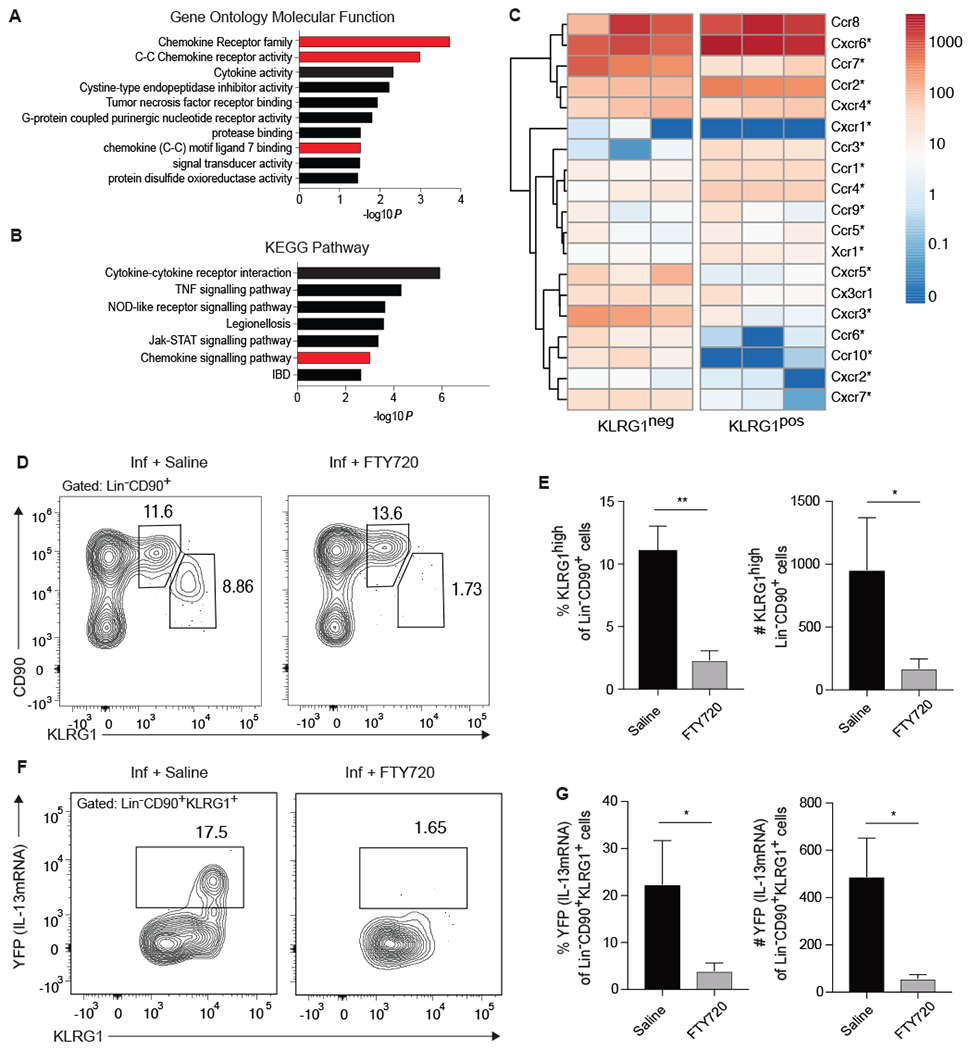
Figure 6: Appearance of KLRG1high pulmonary iILC2s in the lung is blocked by FTY720.

(A-C) RNA sequencing was performed on KLRG1pos and KLRG1neg Lin−CD90+ lung cells from mice treated with IL-33 as described in Figure 1. (A) Gene Ontology Molecular Function and (B) KEGG Pathway analyses highlighting gene groups and pathways that are significantly associated with genes that are at increased at least two-fold in KLRG1pos relative to KLRG1neg populations, as performed in Figure 5. Gene groups and pathways associated with cell trafficking are highlighted in red. (C) Heatmap of chemokine receptor expression in indicated populations from three separate RNA-sequencing experiments. Significant differential expression is denoted by an asterisk. (D-G) IL13yetcre13 mice were infected with N. brasiliensis on day 0 and given saline control or FTY720 on days 0, 2, and 4 after infection. Pulmonary Lin− CD90+ ILC2s were assessed on day 5 by flow cytometry. (D) Representative contour plots of the frequency of KLRG1mid and KLRG1high lung ILC2s. (E) Combined frequency and number of KLRG1high cells, n=3 from a single experiment representative of 3 independent experiments. (F) Contour plots of YFP (IL-13mRNA) expression within the KLRG1+ subset of Lin−CD90+ ILC2s. (G) Combined frequency and number of YFP+ Lin−CD90+KLRG1high cells, n=3 from a single experiment representative of 3 independent experiments. *p≤0.05, **p≤0.01 as determined by two-tailed unpaired t test.
