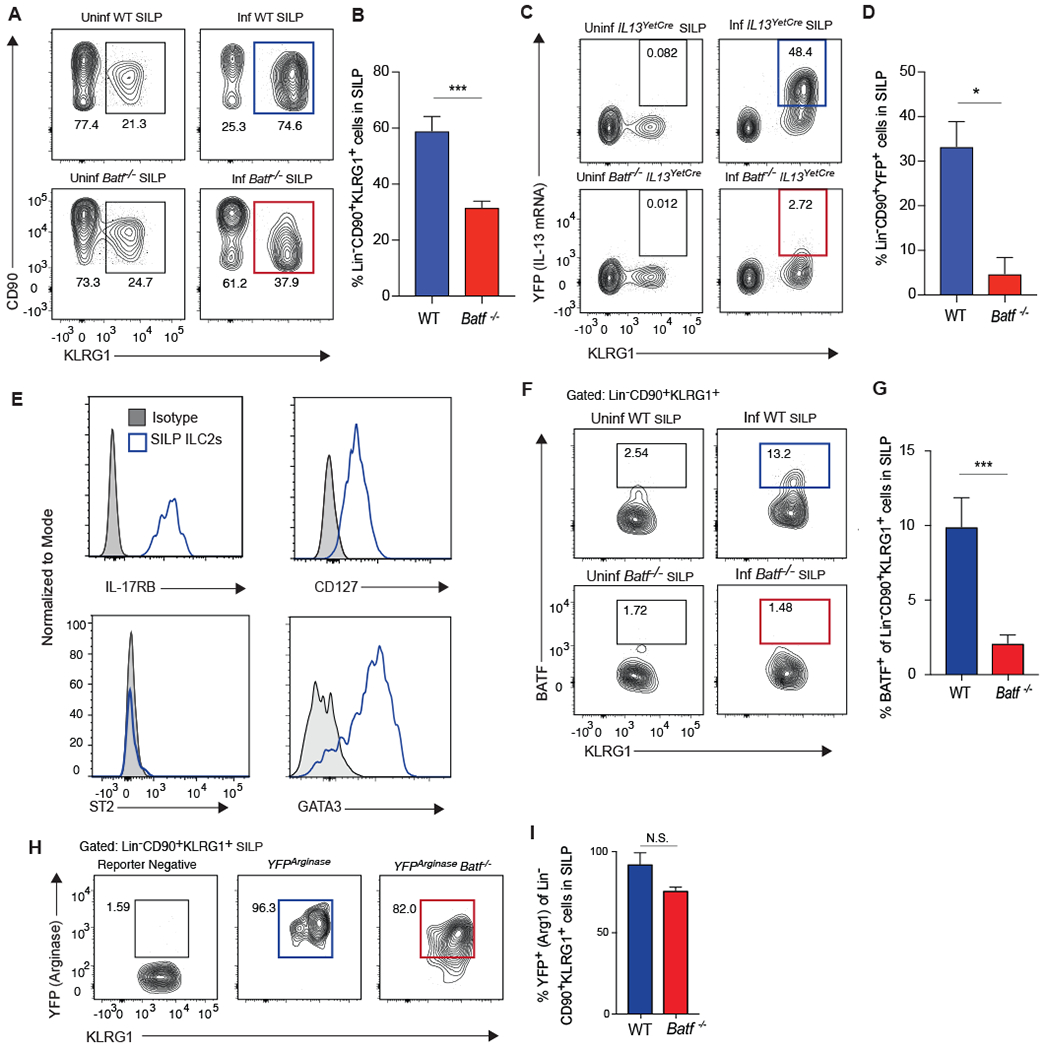
Figure 7: BATF is required for ILC2 function in the small intestine after helminth infection.

(A, B) WT or Batf−/− mice were infected with N. brasiliensis or remained uninfected. Lin− CD90+ KLRG1+ ILC2s in the small intestine lamina propria (SILP) were assessed 5 days after infection by flow cytometry. (A) Contour plots of SILP ILC2s in indicated mice pre- and post-infection. (B) Compiled data comparing the frequency of Lin− CD90+ KLRG1+ cells in the SILP between infected WT (blue) and Batf−/− (red) mice, n=7-9 mice, combined from 3 separate experiments. (C, D) IL13yetcre13 and Batf−/−IL13yetcre13 were infected with N. brasiliensis or remained uninfected. Lin− CD90+ KLRG1+ ILC2s in the SILP were assessed 5 days later by flow cytometry. (C) Contour plots of YFP (IL-13) expression versus KLRG1 expression. (D) Compiled data comparing the frequency of Lin− CD90+ KLRG1+ cells that express YFP (IL-13) in the SILP between infected WT (blue) and Batf−/− (red) mice, n=5 mice, combined from 2 separate experiments. (E) Representative histograms of various surface markers and transcription factors in SILP ILC2s from infected WT mice. (F, G) WT and Batf−/− mice were infected with N. brasiliensis or remained uninfected and Lin−CD90+KLRG1+ ILC2s in the SILP were assessed 5 days later by flow cytometry. (F) Representative contour plots showing the percentage of Lin− CD90+ KLRG1+ ILC2s expressing BATF. Gates were set according to Batf−/− mice. (G) Bar graph showing the percentage of Lin− CD90+ KLRG1+ ILC2s expressing BATF, n=6-8 mice, combined from 3 separate experiments. (H, I) Arg1YFP and Batf−/−Arg1YFP mice were infected with N. brasiliensis and SILP ILC2s were assessed 5 days later by flow cytometry. (H) Representative contour plots showing the percentage of Lin−CD90+KLRG1+ ILC2s that express YFP (Arg1 mRNA). Gates were set according to reporter negative mice. (I) Bar graph showing the percentage of Lin− CD90+ KLRG1+ ILC2s that express YFP (Arg1) between infected WT (blue) and Batf−/− (red) mice, n=6 mice, combined from 2 separate experiments. **p≤0.01, ***p≤0.001 as determined by two-tailed unpaired t test.
