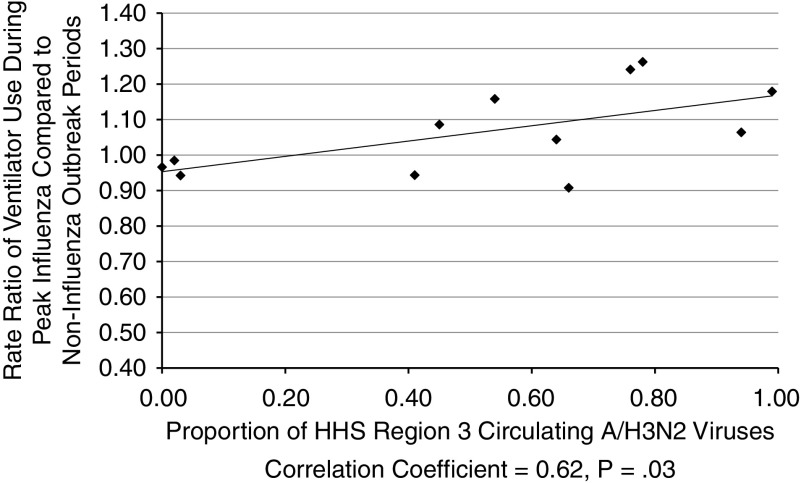
Figure 3.
Rate Ratio (RR) of Ventilator Use During Peak Influenza Outbreaks Compared to the Proportion of Circulating Influenza A/H3N2 Viruses in the Department of Health and Human Services Region 3 During the Same Year in Maryland Residents Older than 64 Years of Age.aCorrelation coefficient = 0.91, P < .0001.

