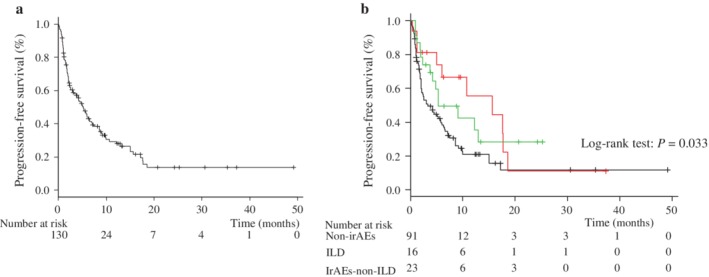
Figure 1.

Rate of progression‐free survival (PFS) in the study population. Kaplan‐Meier curves are shown for progression‐free survival. (a)  Median PFS for overall patients. (b) median PFS,
  line; ILD,
  line; irAEs‐non‐ILD,
  line; non‐irAEs. ILD, interstitial lung disease; irAEs, immune‐related adverse events; NR, not reached.
