
Figure 3.
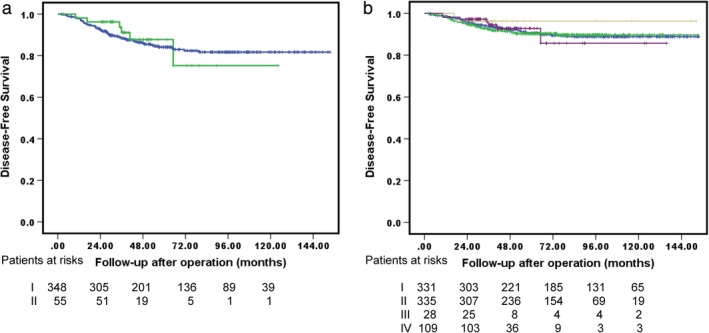
Kaplan‐Meier survival curves for (a) DFS in subgroup analysis with solid‐dominant stage I NSCLC <3 cm who underwent lobectomy or sublobar resection  I. Lobectomy,
  II. Surgeons’ preference sublobar resection, P = 0.721 and (b) DFS of patients subgroup who underwent extent of resection combined with lymphadenectomy.
  I. Lobectomy + LN (+),
  II. Lobectomy + LN (−),
  III. Surgeons’ preference sublobar resection + LN (+),
  IV. Surgeons’ preference sublobar resection + LN (−), P = 0.885.