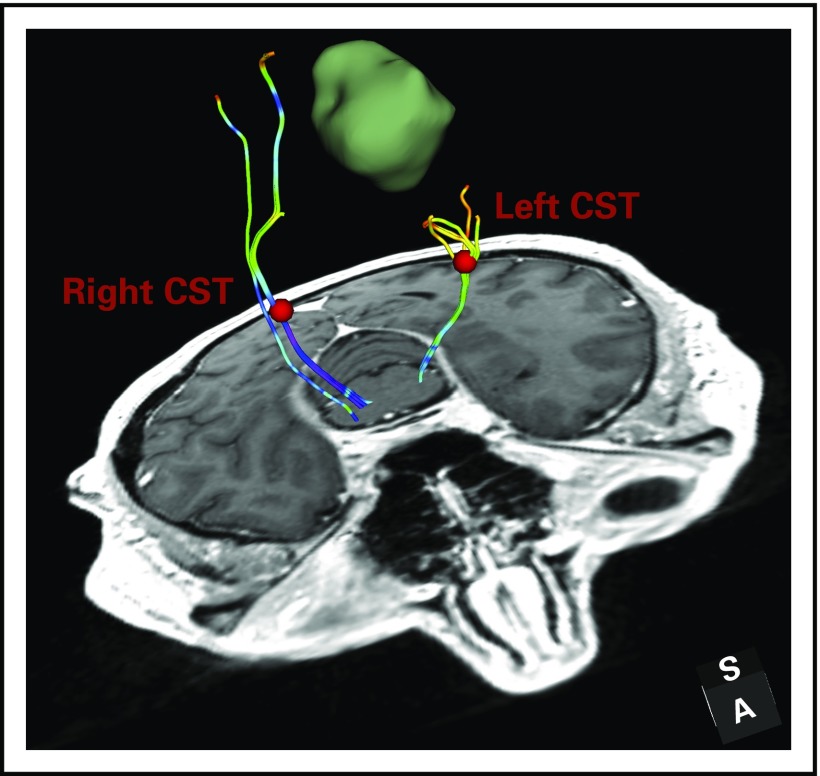
FIG 2.
Diffusion tensor imaging (DTI) tractography analysis for mapping white matter connections in patient data set 1. DTI fiber tracking is seeded from two regions of interest that are placed in the corticospinal tract (CST) bundles in each hemisphere. The fiber tracts are colored by the fractional anisotropy (FA) values of the fiber points along the fiber tract. The mean FA of the fiber tract is 0.48 in the healthy hemisphere and 0.39 in the tumor-bearing hemisphere. The decreased FA is likely related to the tumor-related edema and/or infiltration.

