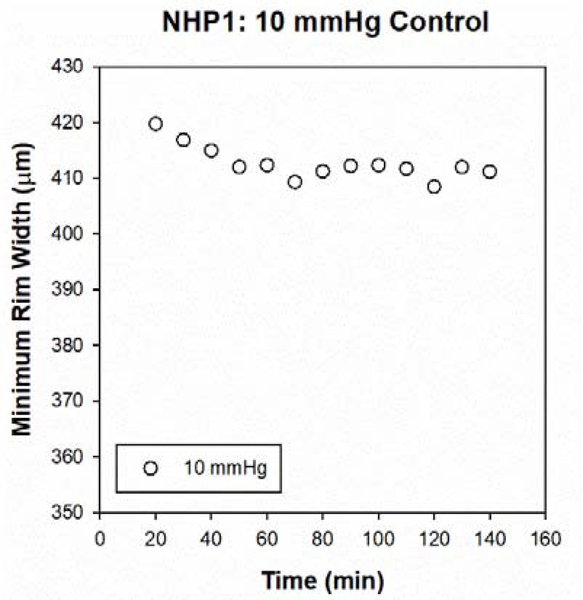
Figure 3. Control cannulation experiment at IOP of 10 mmHg.
BMO-MRW values for NHP1 (animal with the greatest maximum change in BMO-MRW, contralateral eye), starting approximately 20 min after cannulation and quantified every 10 min for 2 hrs. The y-axis scale is the same as Fig 2A&B to facilitate comparison. The decrease in BMO-MRW is approximately 9 μm, compared with decreases of 58 and 64 μm over a similar period of time for the 25 and 40 mmHg experiments, respectively.

