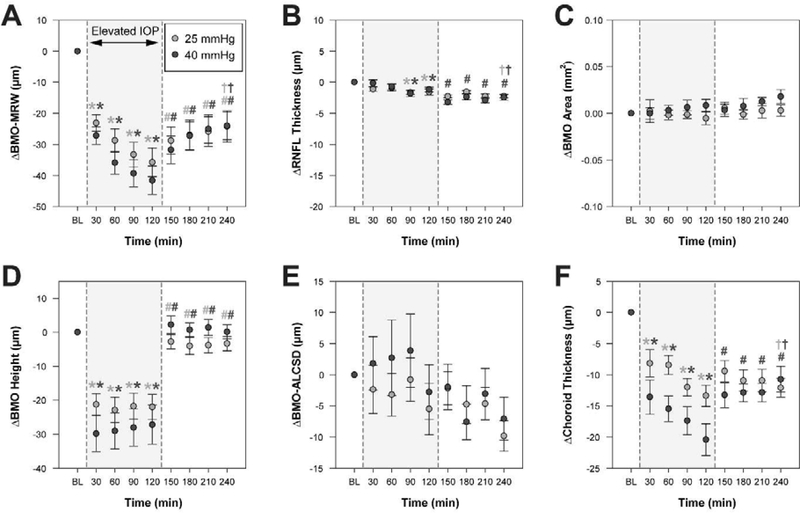
Figure 5. Change in OCT parameters over time during IOP modulation experiments.
Plots illustrate mean difference ± standard error from the final 10 mmHg baseline measure prior to IOP elevation. For comparison with other parameters, BMO-MRW is presented in 30 min intervals. The shaded region shows the period of time over which IOP was elevated to either 25 mmHg or 40 mmHg. Measures during IOP elevation were compared to baseline measures at 10 mmHg, and a statistically significant difference is noted by a light gray and/or dark gray * (light gray * = significant difference for 25 mmHg experiment, dark gray * = significant difference for 40 mmHg experiment). Following IOP reduction to 10 mmHg, measures were compared to the final measure during IOP elevation (i.e., at 120 min), and a statistically significant difference is noted by a light gray and/or dark gray # for the 25 mmHg and 40 mmHg experiments, respectively. A statistically significant difference between endpoint (i.e., 240 min) and baseline is noted by a light gray and/or dark gray † for the 25 mmHg and 40 mmHg experiments, respectively.

