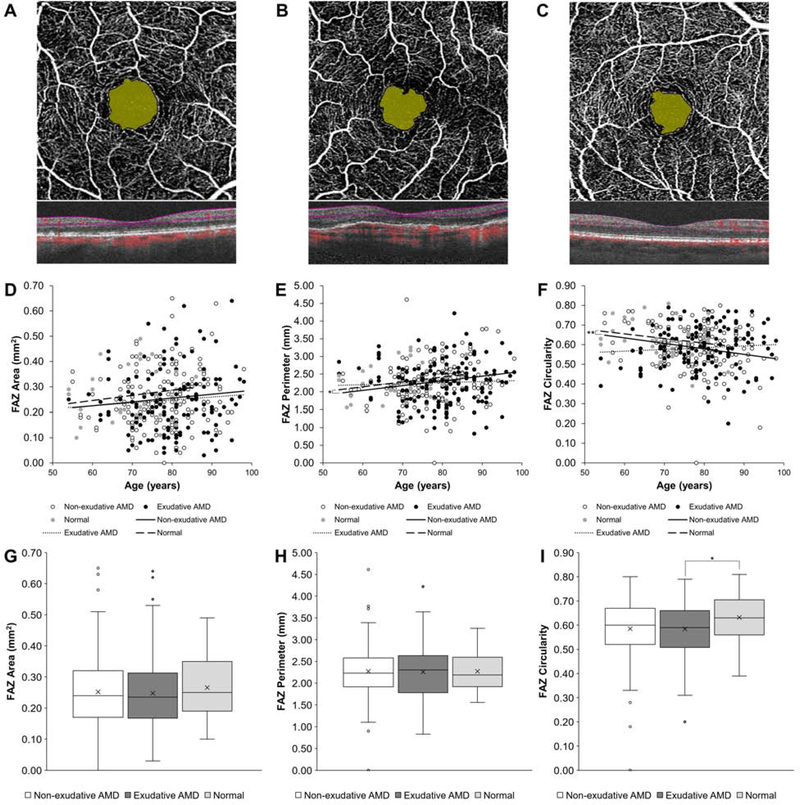
Figure 2. FAZ Measurements in Non-exudative and Exudative Age-Related Macular Degeneration.
Representative OCT-A and spectral-domain OCT scans of eyes with non-exudative (A) and exudative (B) AMD and a normal control (C) with foveal avascular zone (FAZ) area highlighted. Scatterplots with linear regression trendlines showing FAZ area (D), perimeter (E), and circularity (F) in eyes with non-exudative and exudative AMD and normal eyes across different patient ages. Box-and-whisker plots comparing FAZ area (G), perimeter (H), and circularity (I) in eyes with non-exudative and exudative AMD and normal eyes. *, P<0.05; **, P<0.01

