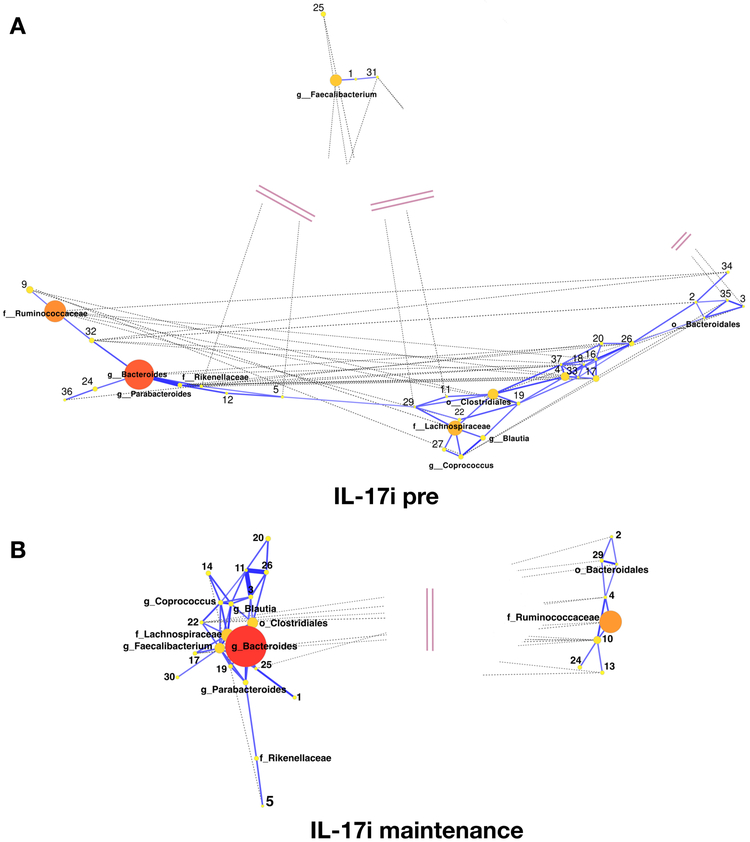
Figure 3: Co-occurrence networks of bacterial taxa pre- and post-treatment with IL-17i.
(A) IL-17i pre (baseline) visit. (B) IL-17i post (maintenance) visit. Nodes represent individual taxa, with the size and color denoting relative abundance (large/red nodes – high abundance; medium/orange nodes – medium abundance; small/yellow nodes – low abundance). Edges represent significant correlations between taxa, with solid blue lines corresponding to positive correlations and dashed gray lines corresponding to negative correlations. Edge lengths are inversely proportional to correlation strength. Pink double lines represent truncated edge distances.

