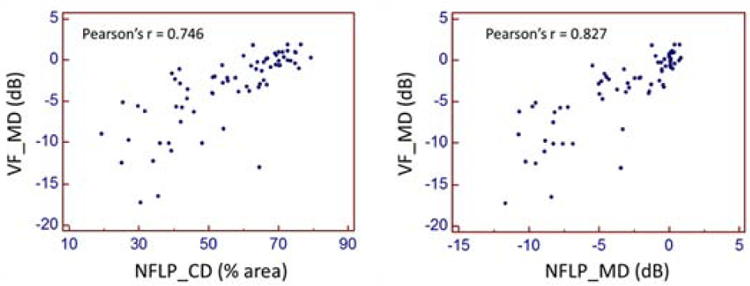
FIGURE 4.

Pearson correlation of optical coherence tomographic angiography parameters and visual field mean deviation (VF-MD). NFLP_MD correlated with VF_MD better than NFLP_CD (P=0.001). NFLP_MD = nerve fiber layer plexus mean deviation; (simulated visual field mean deviation); NFLP_CD = nerve fiber layer plexus capillary density.
