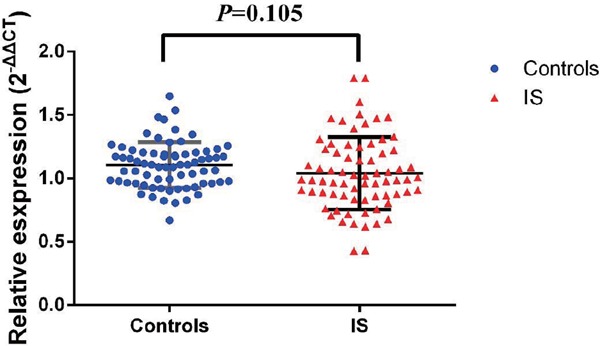
Supplementary Fig. 2.

The comparison of ACTB mRNA expression between IS and controls
No significant difference of ACTB mRNA was observed between IS and controls (1.03 ± 0.28 vs 1.1 ± 0.18, P = 0.105)

The comparison of ACTB mRNA expression between IS and controls
No significant difference of ACTB mRNA was observed between IS and controls (1.03 ± 0.28 vs 1.1 ± 0.18, P = 0.105)