Fig. 1.
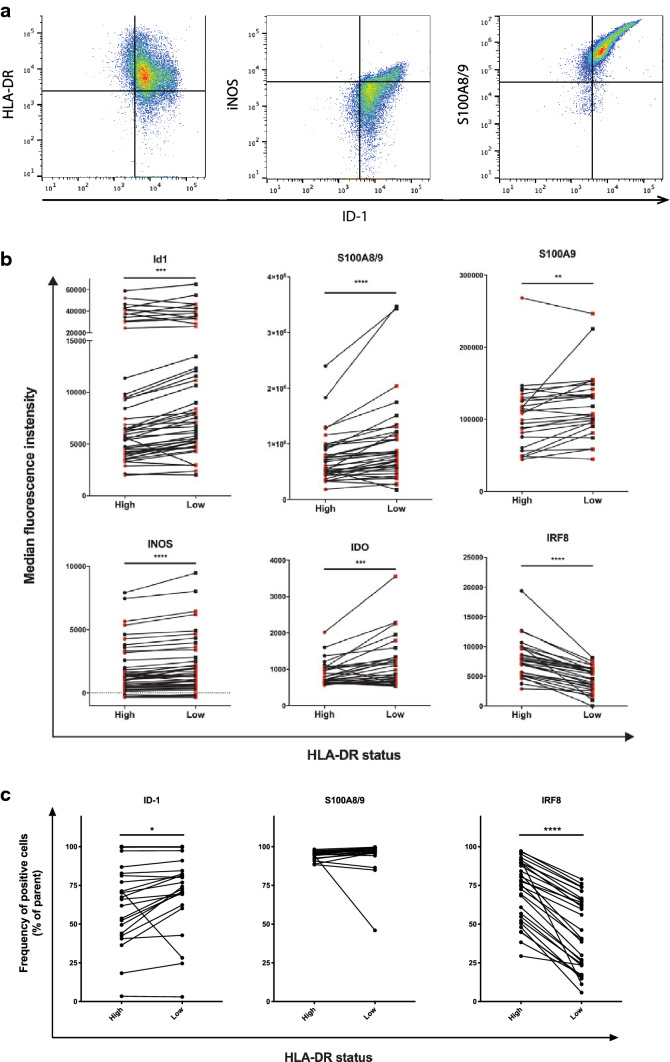
Expression of ID1 on monocytes coincides with known phenotypic characteristics of monocytic MDSC. a Flow cytometric analysis of PBMC from melanoma patients. Doublets were excluded and live PBMC were gated (not shown). Representative plots depicting the subpopulation of CD33+CD11b+CD14+ cells, indicating expression of ID1 plotted against markers commonly used for characterization of monocytic MDSC, with gates to indicate cells positive for ID1, HLA-DR, iNOS, and S100A8/9. b Flow cytometric analysis of CD33+CD11b+CD14+ cells within melanoma patient PBMC, indicating median fluorescence intensities in HLA-DRhigh monocytes versus HLA-DRlow monocytic MDSC for ID1, S100A8/9, S100A9, iNOS, and IRF8. c Frequencies of cells positive for ID1, S100A8/9, and IRF8 with HLA-DRhi and HLA-DRlow monocytes. **p < 0.01; ***p < 0.001; ****p < 0.0001

