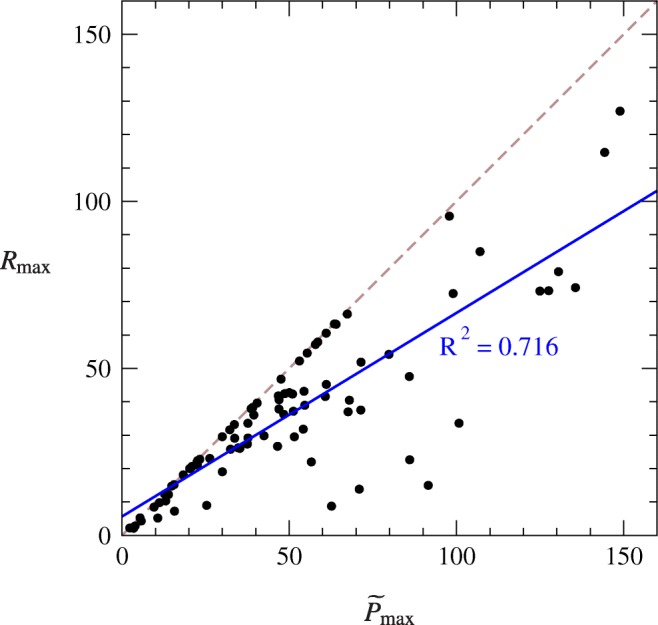
Fig. 6.

Plot of the values of Rmax against for demand curves for cocaine consumption by nine male rats over 86 separate sessions. The values of the two quantities are substantially correlated (R2 = 0.716) and clearly obey the rule Rmax ≤ derived at the end of “Elasticity and measures of motivation.” (The dashed line shows the point at which Rmax = , and all points lie on or below this line.) Three extreme outliers on the horizontal axis have been omitted from the plot and from the fit, as discussed in the text
