


Fig. 2.
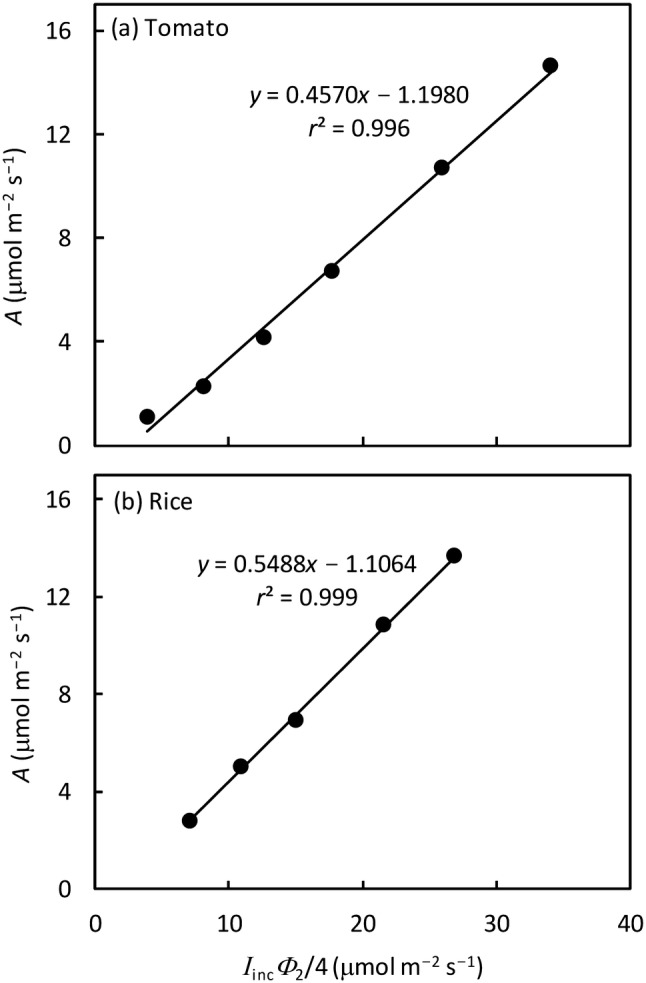
Linear relationship between net CO2 assimilation rate A and IincΦ2/4, where Φ2 is set to be and Iinc is ≤ 200 μmol m−2 s−1 (each point represents the mean of measurements on leaves from four replicated plants), for nonphotorespiratory condition (2% O2 combined with Ca = 1000 μmol mol−1). The intercept of regression lines gives an estimate of −Rd (see Yin et al., 2011), and the slope gives an estimate of the calibration factor s for converting into the linear electron transport rates (see the text)