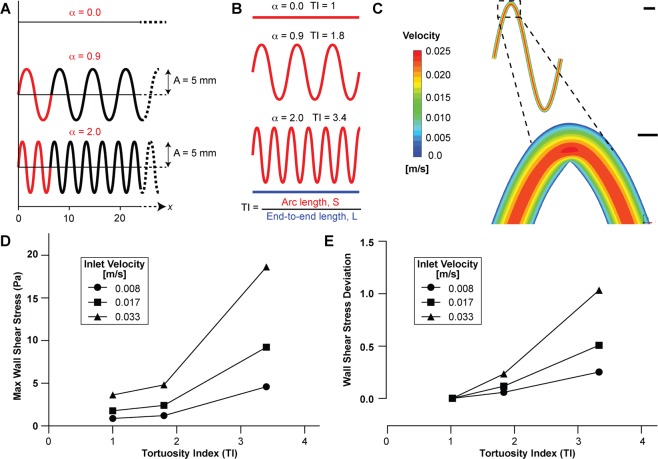
Figure 1.
Design and computational analysis of tortuous microchannels. (A) The tortuous microchannels were designed in Solidworks (v2019; www.solidworks.com) as sinusoidal curves of varying frequency (α, red), fixed amplitude (A, 5 mm), and fixed total length along x-axis (56 mm). (B) Illustration of computed tortuosity index (TI). TI was calculated as the ratio of the arc length (S, red) to end-to-end distance (L, blue, fixed at 56 mm). (C) Representative heatmaps showing velocity profile in microchannel of TI = 3.4 at an inlet velocity of 0.017 m/s (scale bar: top, 500 µm; bottom, 100 µm). Graph showing (D) maximum wall shear stress (Pa) and (E) wall shear stress deviation (fluid shear gradients) as a function of increasing inlet velocities for TI = 1 (circle), 1.8 (square) and 3.4 (triangle). CFD analysis was performed using Ansys (v19.2; www.ansys.com).

