Figure 4.
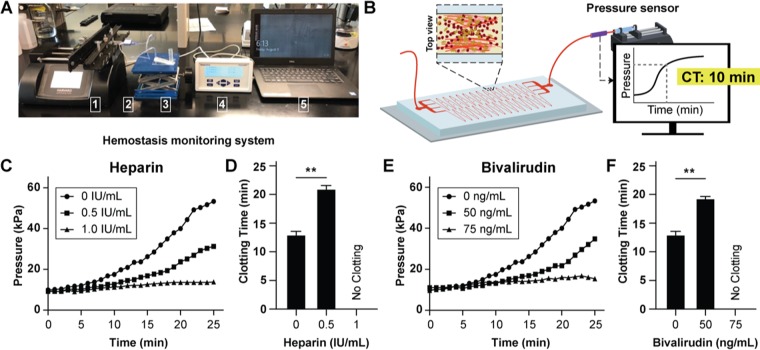
Analysis of thrombin inhibitors with in-line pressure sensor. (A) Photograph showing experimental setup that consists of a syringe pump (1) connected to an in-line pressure sensor (2), microfluidic device (3), pressure display monitor (4), and laptop computer (5). The syringe pump pulls the blood at a constant flow rate through the outlet of the microfluidic device and the changes in fluid pressure caused by channel occlusion are detected by the pressure sensor which sends the pressure data to the laptop computer for display. (B) Conceptual illustration of experimental set up and measurement of clotting time from pressure data. (C) Graph showing mean pressure trace measured in the device when re-calcified citrated whole blood treated with varying heparin doses (0, 0.5, 1.0 IU/mL) was perfused (mean shear rate, 1,200 1/s) through collagen coated devices (n = 3 donors, 1 replicate per experiment) (D) Clotting time (CT) derived from heparin pressure trace; (no clotting, **P < 0.01, n = 3 donors). (E) Graph showing mean pressure trace measured in the device when re-calcified citrated whole blood treated with varying bivalirudin doses (0, 50, 75 ng/mL) was perfused (mean shear rate, 1,200 1/s) (n = 3 donors, 1 replicate per experiment). (F) Clotting time (CT) derived from bivalirudin pressure trace; (no clotting, **P < 0.01, n = 3 donors).

