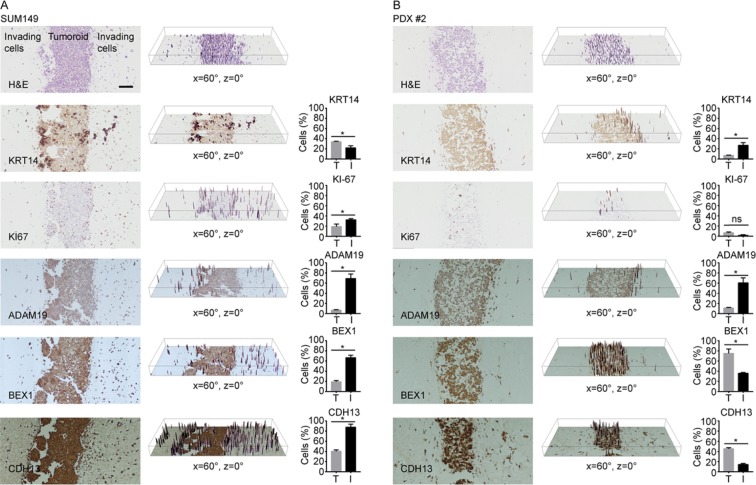
Figure 3.
Immunohistochemistry of tumoroids for markers of invasion. SUM149 (A) and PDX #2 (B) tumoroids were stained for KRT14, Ki67, ADAM19, BEX1 and CDH13. 3D surface plots of staining intensity (represented in the middle panel of each row) while quantification of staining intensity in tumoroid (T) or invading cells (I) indicated as the percentage of cells that display stronger staining (represented in the third panel of each row). n = 3 *p-value < 0.05; ns = not significant.

