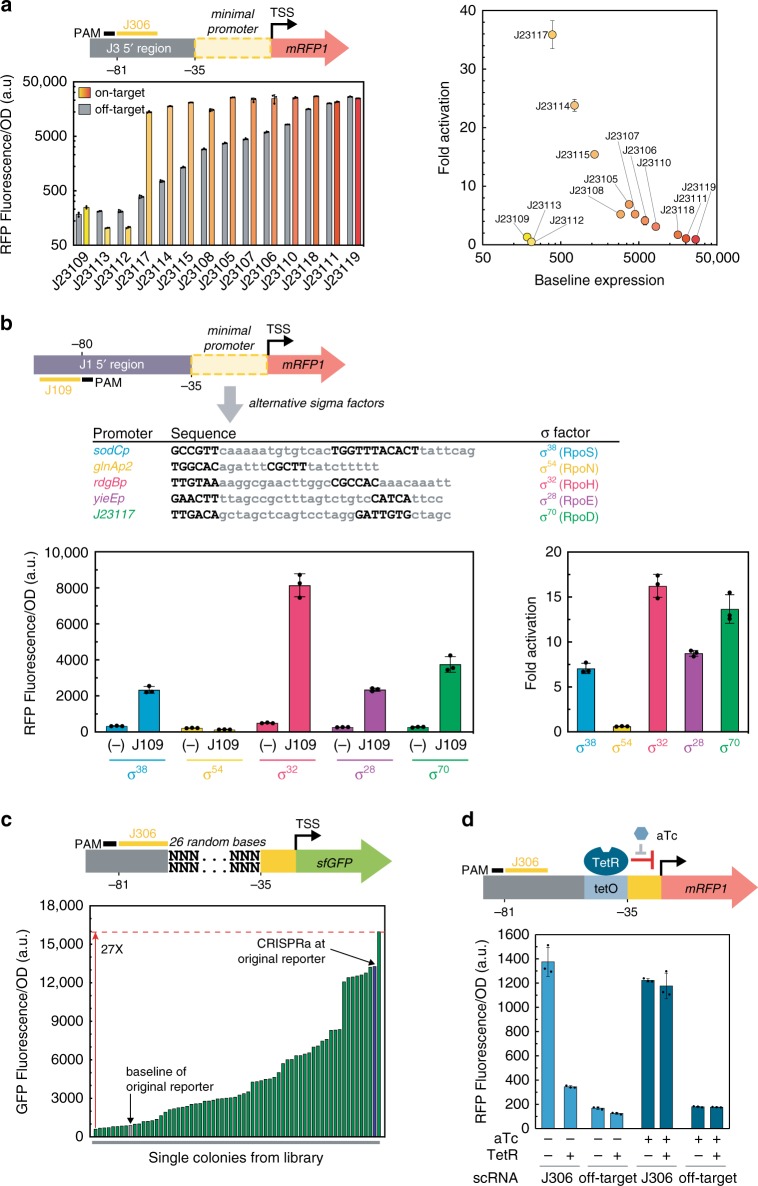
Fig. 3. CRISPRa is sensitive to promoter identity and local sequence.
a CRISPRa is sensitive to promoter strength. Promoters contain a scRNA target site at −81 from the TSS of the indicated J231NN minimal promoter, on the non-template strand3. The panel on the left shows the Fluorescence/OD600 of strains expressing an on-target or off-target scRNA. The panel on the right shows the fold activation measured at each promoter relative to their baseline expression with an off-target scRNA (J206). b CRISPRa can activate promoters regulated by σ38 (RpoS), σ32 (RpoH), and σ24 (RpoE) sigma factors. The minimal promoter from the reporter plasmid was replaced with sodCp, glnAp2, rdgBp, or yieEp. The −35 and −10 regions are highlighted in bold. The plot on the left shows the Fluorescence/OD600 when CRISPRa targeted each promoter at the J109 target site (−80 from the TSS on the template strand) or with an off-target scRNA (hAAVS1, labeled (−)). The plot on the right shows the fold activation measured at each promoter relative to an off-target scRNA (J206). c CRISPRa activity differs significantly among promoters with varying sequence composition between the scRNA target and the −35 region. Green bars represent the Fluorescence/OD600 of overnight cultures from individual colonies. The blue bar represents the Fluorescence/OD600 of a strain expressing the J3-J23117-sfGFP reporter, activated by CRISPRa with the J306 scRNA. The gray bar represents a negative control expressing the J3-J23117-sfGFP reporter plasmid with CRISPRa targeting an off-target site (J206). d CRISPRa was inhibited binding of the TetR transcriptional repressor binding to a tet operator (tetO) site placed upstream of the −35 region. Cultures where CRISPRa was targeted to the J306 site or to an off-target site (J206) were grown overnight in media ±1 μm aTc. In panels a, b, and d, values represent the average±standard deviation calculated from n = 3 biologically independent samples. c Bars represent the value of n = 1 biologically independent samples. Source data are provided as a Source Data file.

