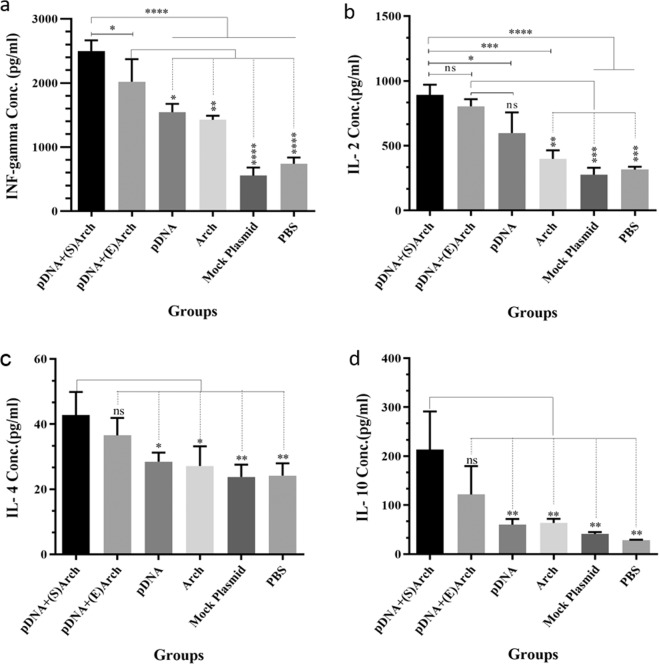
Figure 4.
The level of cytokine production by splenocytes of immunized mice. Splenocytes obtained from immunized mice were cultured in triplicate for each mouse and stimulated with appropriate mitogen. After 72 h supernatants were collected and analyzed by sandwich ELISA method to measure (a) IFN-γ, (b) IL-2, (c) IL-4 and (d) IL-10 levels separately. The data are shown as mean ± S.D responses of each group. The levels of statistical significance for differences between experimental groups were determined using ANOVA followed by Turkey’s post-test. The ns indicates not significant difference between groups. The asterisks indicate the groups, which were significantly different. *(P < 0.05), **(p < 0.01), ***(P < 0.001) and ****(P < 0.0001). (Abbreviations: pDNA + (S)Arch: pDNA-surface localized archaeosome; pDNA + (E)Arch: pDNA-encapsulated archaeosomes; pDNA: pDNA alone (L1/E6/E7 recombinant gene); Arch: archaeosomes alone (antigen-free archaeosomes); Mock Plasmid: pIRES.

