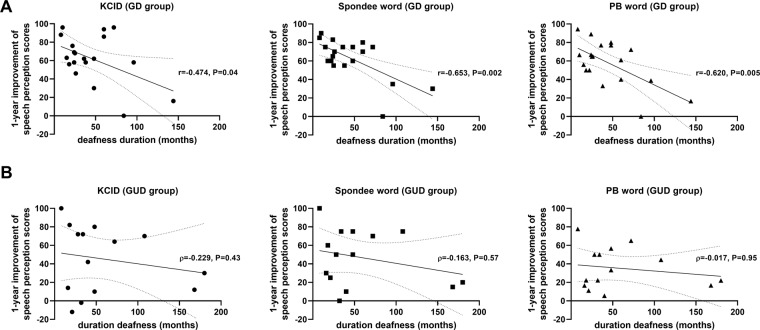
Figure 4.
Correlation analyses of the duration of deafness and improvement in speech perception scores according to the presence of identifiable genetic etiology. (A) Using Pearson correlation analyses, the duration of deafness was found to be inversely correlated with 1-year improvement in K-CID (r = −0.474, P = 0.04), Spondee word (r = −0.653, P = 0.002), and PB word (r = −0.620, P = 0.005) test scores in the GD group. The dotted line indicates statistical significance. The grey color indicates the 95% confidence interval. (B) Using Spearman correlation analyses, the duration of deafness was found not to be inversely correlated with 1-year improvement of K-CID (ρ = −0.229, P = 0.43), Spondee word (ρ = −0.163, P = 0.57), and PB word (ρ = −0.017, P = 0.96) scores in the GUD group. The dotted line indicates the 95% confidence interval.

