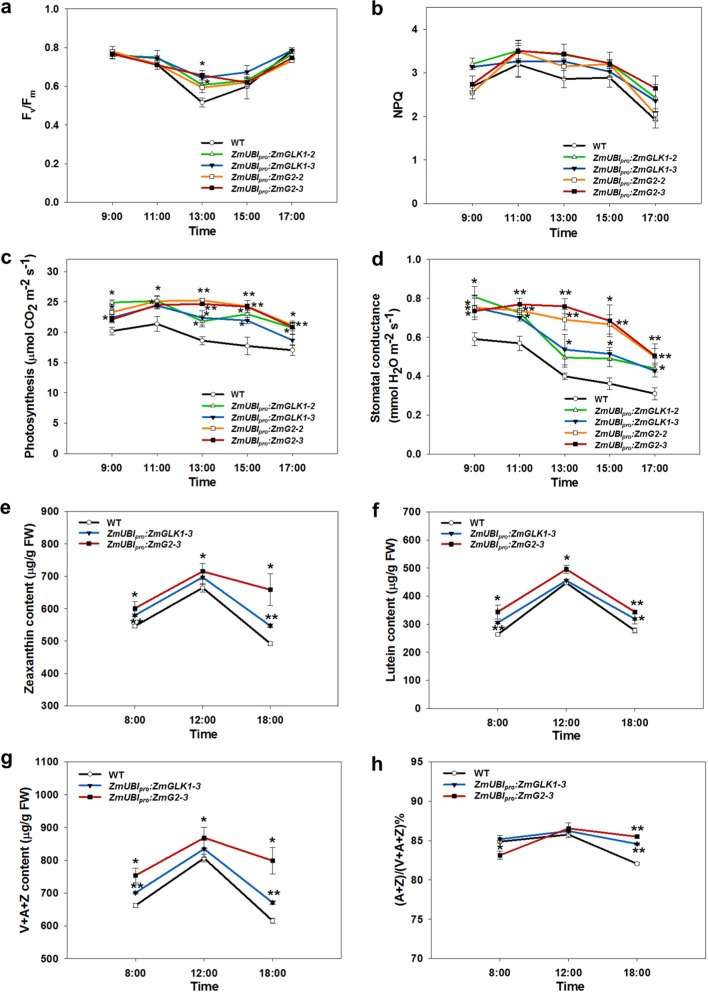
Fig. 3. Diurnal variation of photosynthetic parameters and xanthophyll pigments.
a, b Diurnal change in Fv/Fm (a) and NPQ (b) values of flag leaves at the heading stage in the field in Beijing, 2018. Measurements were performed using a FluorPen. PPFD at each time point was 800, 1500, 2000, 900, and 350 µmol m−2 s−1, respectively. Data are mean ± SE (n = 4 biological replicates). c, d Diurnal curves of photosynthesis (c) and stomatal conductance (d) measured using a LICOR-6400 XT in the field from 9 a.m. to 5 p.m. in Hainan, 2019. PPFD at each time point was 600, 1200, 1500, 900, and 300 µmol m−2 s−1, respectively. All measurements were conducted with at least four biological replicates. Data are mean ± SE. e, f Diurnal change in zeaxanthin (e) and lutein (f) content. g Diurnal change in total content of xanthophyll pigments (V + A + Z). h Diurnal change in de-epoxidation state of the xanthophyll cycle calculated as the ratio (A + Z)/(V + A + Z)%. All pigments were measured in flag leaves sampled at the heading stage at 8 a.m., 12 a.m., and 6 p.m. from the field experiment in Beijing, 2019. Data are mean ± SE (n = 3 biological replicates). *P < 0.05, **P < 0.01 compared with WT according to a two-tailed Student’s t test.

