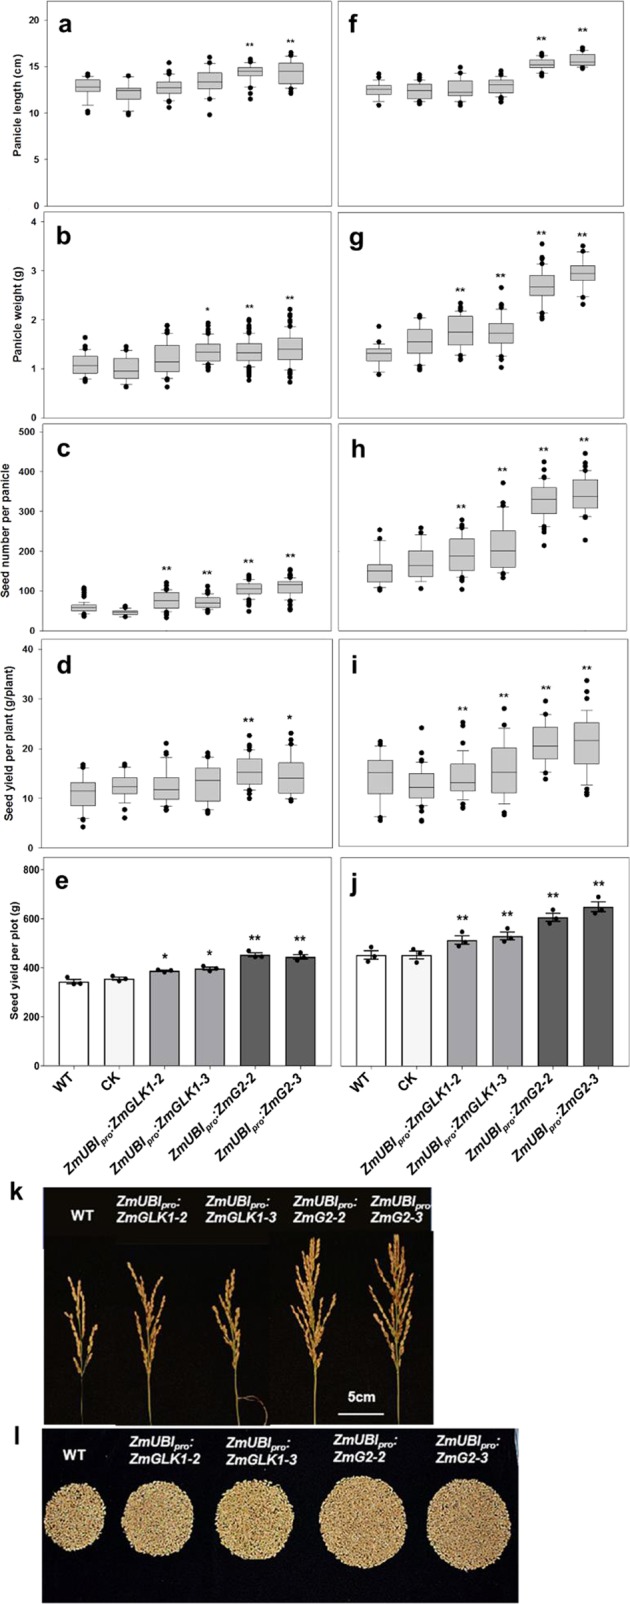
Fig. 6. Enhanced grain yield in ZmUBIpro:ZmGLK1 and ZmUBIpro:ZmG2 transgenic lines in Beijing and Hainan.

a–e Yield parameters obtained from the field experiment in Beijing, May 2018 to September 2018. f–j Yield parameters obtained from the field experiment in Hainan, December 2017 to April 2018. All data except e and j were calculated from at least 20 independent rice plants. Seed yield per plot (e, j) was calculated from 30 independent rice plants within a plot and three plots that were placed randomly in the field. CK = null segregants isolated from selfed heterozygous transgenic plants. Box and whisker plots show median (line) and outliers (black dots (•)). In e, j, data are mean ± SE (n = 3 replicates). *P < 0.05, **P < 0.01 compared with WT according to a two-tailed Student’s t test. k, l Comparison of single panicle (k) and seed yield per plant (l) of WT and transgenic plants from the field experiment in Hainan, December 2017 to April 2018. Scale bars = 5 cm.
