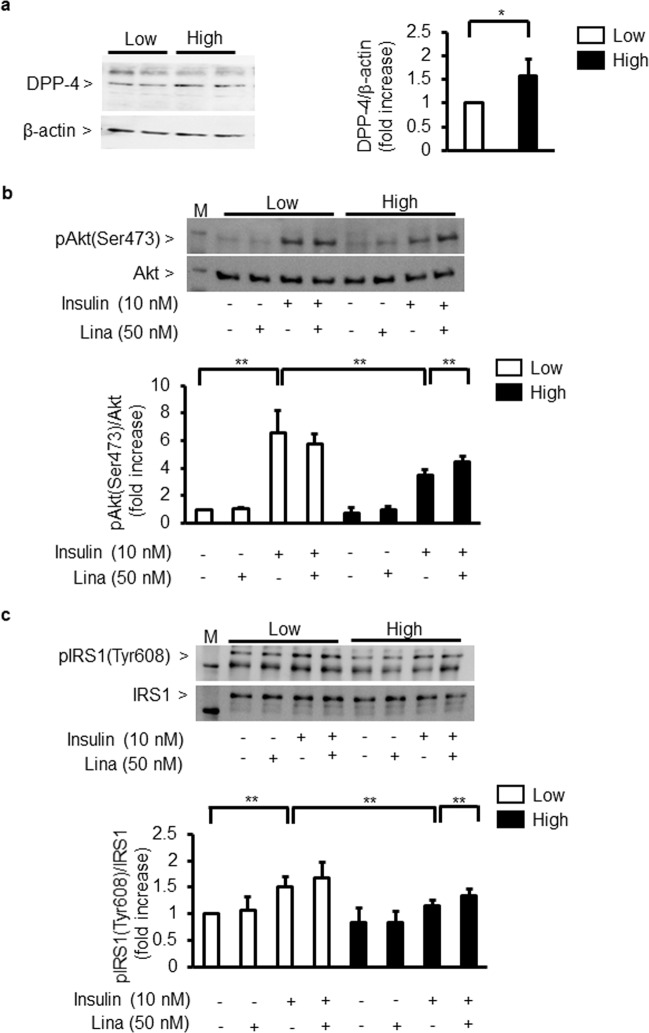
Figure 2.
Effect of linagliptin on insulin signalling in cultured podocytes. (a) Immunoblot analysis of DPP-4. Podocytes were incubated with low glucose (5.5 mM) or high glucose (25 mM). *P < 0.05. (b,c) Immunoblot analysis of Akt and IRS1 phosphorylation. After 96 h of exposure to low glucose (5.5 mM) or high glucose (25 mM), podocytes were incubated with insulin (10 nM, 5 min) in the absence or presence of linagliptin (50 nM). (b) phospho-Akt. (c) phospho-IRS1. Low; low glucose. High; high glucose. Lina; linagliptin. **P < 0.01. These data are expressed as means ± SD. Results are representative of one of three independent experiments.

