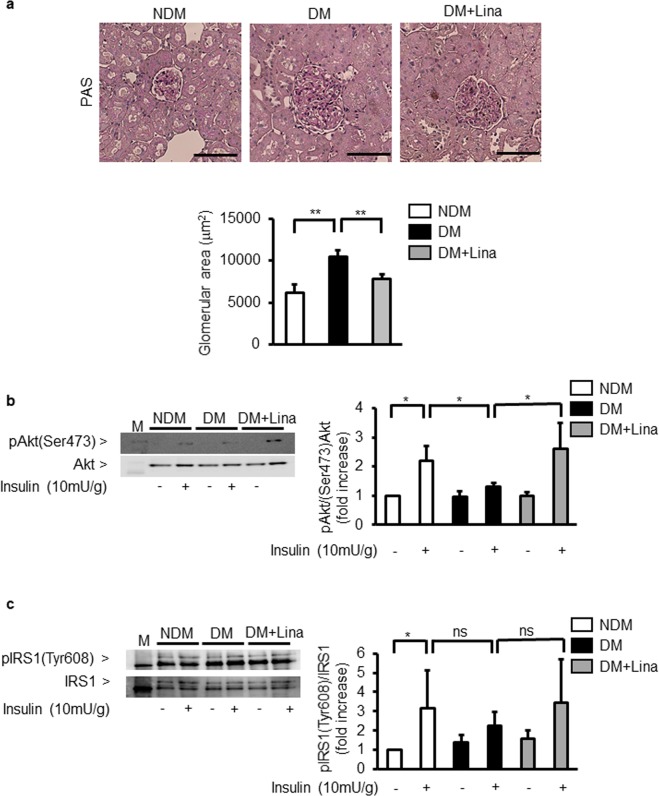
Figure 3.
Effect of linagliptin on Akt and IRS1 in the glomeruli of diabetic Sprague-Dawley (SD) rats. (a) Representative light microscopic appearance of glomeruli (PAS staining) and morphometric analysis of glomerular area. NDM; nondiabetic SD rats, DM; STZ-induced diabetic SD rats; Lina, linagliptin. Bar=100 μm. **P < 0.01. (b,c) Representative immunoblots of tyrosine phosphorylation of Akt (b) and IRS1 (c) from glomeruli. Solubilized glomeruli were subjected to immunoprecipitation followed by immunoblotting. NDM; nondiabetic SD rats, DM; STZ-induced diabetic SD rats; Lina, linagliptin. *P < 0.05. ns; not significant. These data are expressed as means ± SD. Results are representative of one of three independent experiments.

