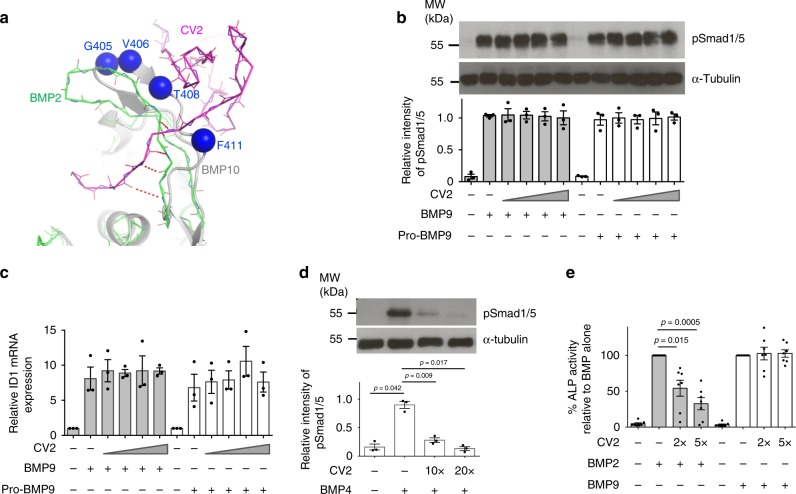
Fig. 7. CV2 does not inhibit BMP9 signalling.
a Structural analysis. BMP10 (grey, with conserved region 2 residues in blue spheres) was overlaid onto the BMP2:CV2 structure (PDB:3BK3, CV2 in magenta and BMP2 in green). Four mainchain H-bonds that stabilise the BMP2:CV2 β-sheet interaction are shown. BMP9 has the same conformation as BMP10 in this region. b, c CV2 does not inhibit BMP9 signalling in PAECs. Serum-starved PAECs were treated with BMP9 or pro-BMP9 (at 1 ng ml−1 GF-domain concentration) without or with CV2 at 10-fold, 20-fold, 50-fold or 250-fold molar excess for 15 min to assess Smad1/5 phosphorylation using immunoblots (b) or for 1 h to assess ID1 gene expression using qPCR (c). One representative of three independent experiments is shown in b. Band intensity was quantified using Image J (version 1.51s). d CV2 inhibits BMP4 signalling in PASMCs. Serum-starved PASMCs were treated with BMP4 (25 ng ml−1) without or with CV2 at indicated molar excess for 15 min. Immunoblots and quantification were carried out as above. N = 3 independent experiments and one representative blot is shown. e CV2 inhibits BMP2 but not BMP9 signalling in C2C12 cells. Serum-starved C2C12 cells were treated with BMP2 (130 ng ml−1) or BMP9 (25 ng ml−1) without or with CV2 at the indicated molar excess for 68 h. ALP activity in the cell lysate were analysed (see Methods section). N = 7 independent experiments. For all panels, means ± SEM are shown. d, e One-way ANOVA for each BMP treatment group, Dunnett’s post hoc analysis against BMP alone-treated controls. Source data are provided as a Source Data file.

