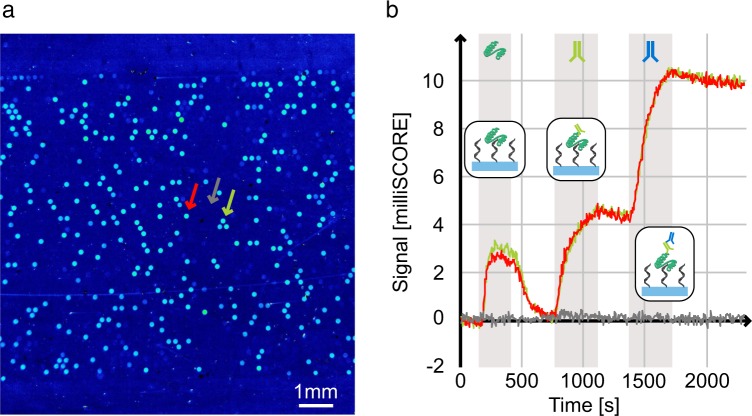
Figure 6.
SCORE binding experiment using a generated DNA microarray. (a) Endpoint binding image of the DNA microarray. The brighter the signal, the more higher the binding signal is. (b) Detailed binding kinetic data for two DNA spots and one background spot (as indicated by arrows in (a)). The gray bars illustrate the time frames of analyte injections which are separated by washing steps. The analyte flushing sequence consists of a Thrombin step followed by an anti-Thrombin antibody step followed by a secondary antibody step. Furthermore, the binding steps are illustrated by small schematic pictures.

