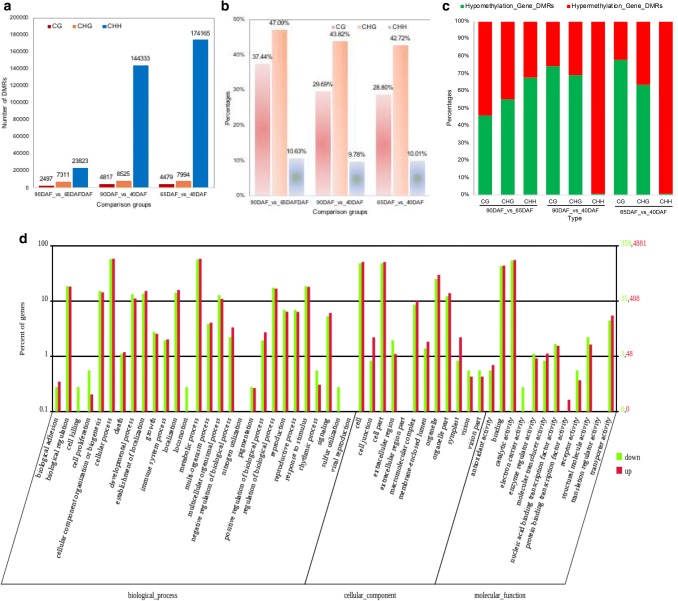
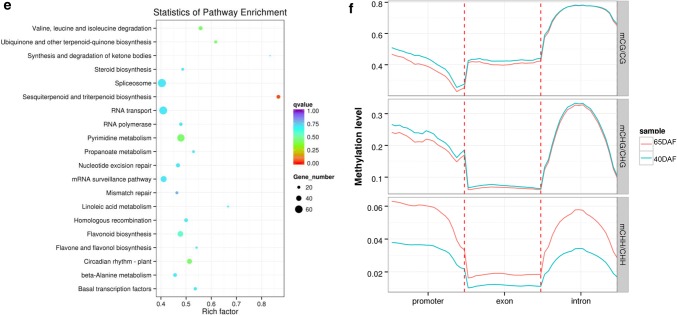
Fig. 4.
DMRs distribution between any of fruits at different developmental stages. a The number of DMRs distribute between any of the fruits at different developmental stages. b The percentage of Gene_DMRs distribute between any of the fruits at different developmental stages. c The percentage of hypomethylation and hypermethylation of Gene_DMRs between any of the fruits at different developmental stages. d Analysis of hypermethylated and hypomethylated DMR associated genes of 65DAF_vs_40DAF using WEGO analysis. Green bar indicates the hypomethylated DMR associated gene, and red bar indicates the hypermethylated DMR associated gene. e Top 20 statistics of pathway enrichment for 65DAF_vs_40DAF. The circle size represented the gene number and the circle color represented the q-value of pathway enrichment analysis. f The comparison of DNA methylation level of DMR associated genes in 65DAF_vs_40DAF (color figure online)


