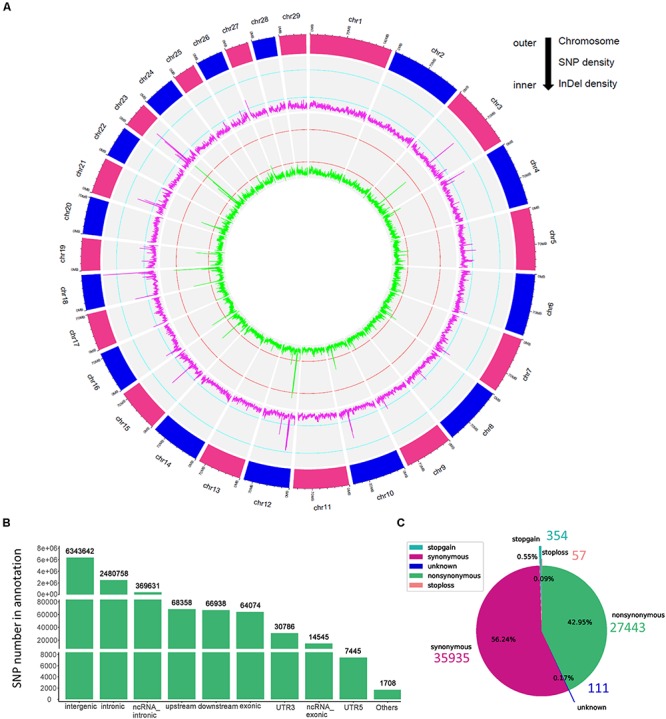
FIGURE 1.

The genomic variants identified and annotated in Jining Gray goat. (A) Circos plot of variants density after filtration. The density of variants was calculated in each 100 kb step size. From outer to inner, the outermost circos depicts each chromosome, the middle displayed the SNP density per window (magenta), and the internal circos meant the indel density per window (green). The cyan and red lines in secondary and third cycle was indicated the 0.25 and 0.75 stack height, respectively. (B) Genomic annotation of SNPs according to ANNOVAR. “Others” contained a few other categories of “upstream; downstream,” “splicing,” “ncRNA_splicing,” “exonic; splicing,” “UTR5; UTR3,” and “ncRNA_exonic; splicing.” (C) The pie plot of annotated SNPs at exonic regions.
