
FIGURE 4.
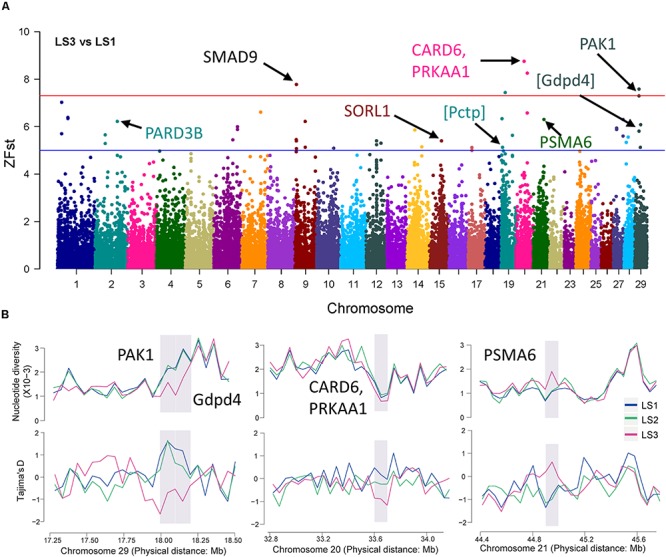
Selective sweep of Jining Gray goat groups with LS3 vs LS1. (A) Mahattan Plot of Z(Fst) values of LS3 vs LS1 groups. The blue line is “suggestiveline,” –log10(1e – 05), red line is “genomewideline,” –log10(5e – 08). (B) Distribution of Tajima’s D values and π in LS1, LS2, and LS3 groups at selective regions. The selective regions were marked with gray shadow.