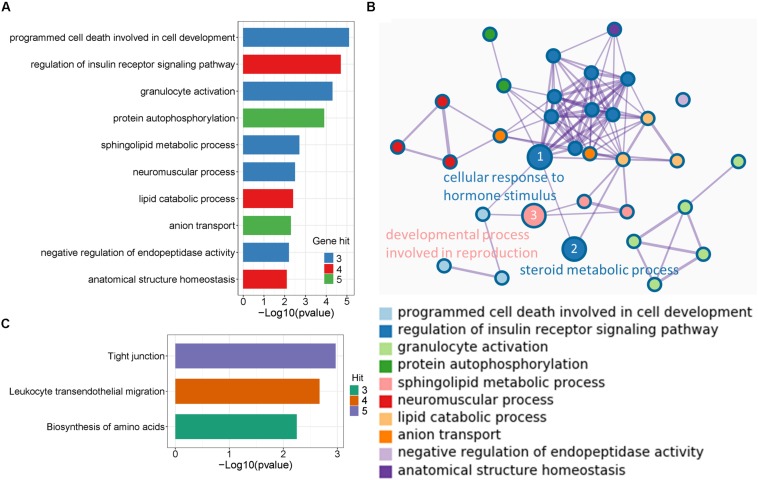
FIGURE 5.
Enrichment analysis of candidate genes. (A) The top non-redundant go enrichment clusters of genes in selected region both of LS2 vs LS1 and LS3 vs LS1 groups. Per cluster use a discrete color scale to represent statistical significance. (B) Metascape enrichment network showing the intra-cluster and inter-cluster similarities of enriched go terms. Node size is reflected by gene hits in the go term. (C) Enriched KEGG pathway of candidate genes.

