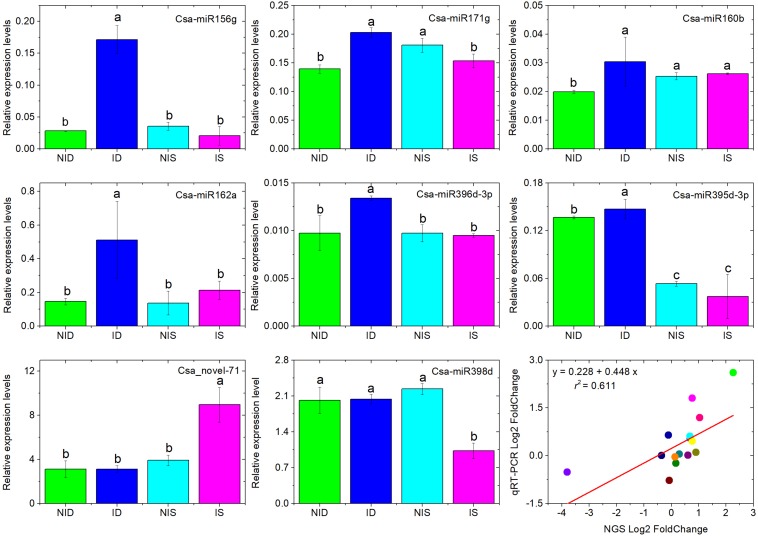
FIGURE 3.
Analysis of eight selected miRNAs in cucumber SSSL508-28 and D8 lines 48 h after PM inoculation by stem-loop qRT-PCR. Data are the means of three replicates (±SD). The U6 gene was used as an internal control to normalize the expression data. Means with the same lowercase letter do not significantly differ by the least significant difference test at p ≤ 0.05 with a completely randomized design. Regression analysis between the eight miRNA expression levels measured by RNA sequencing and qRT-PCR indicates strong correlation between the two approaches with Pearson correlation coefficient r2 = 0.611. The gene expression values were transformed to the log2 scale.

