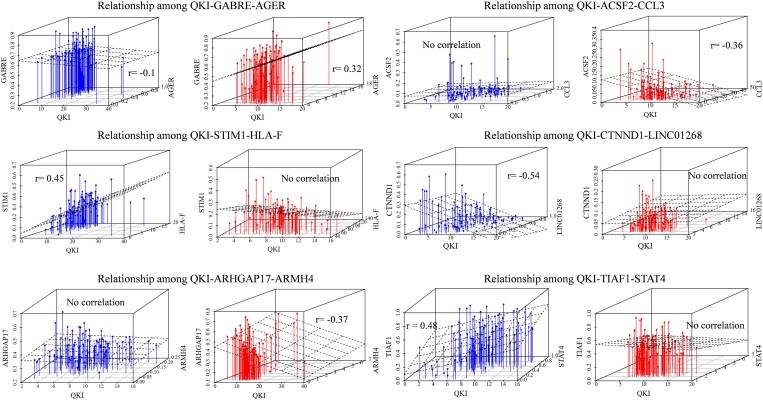
FIGURE 3.
Relationships among QKI-modulator-target. The blue means the samples in modulator expression low group (expression in bottom 33%), the red means the samples in modulator expression high group (expression in top 33%). The correlation value is the Pearson correlation between expression level of QKI and the splicing outcomes of its targets. No correlation means the statistical p-value of correlation is not significant (p-value cutoff setup as 0.01).

