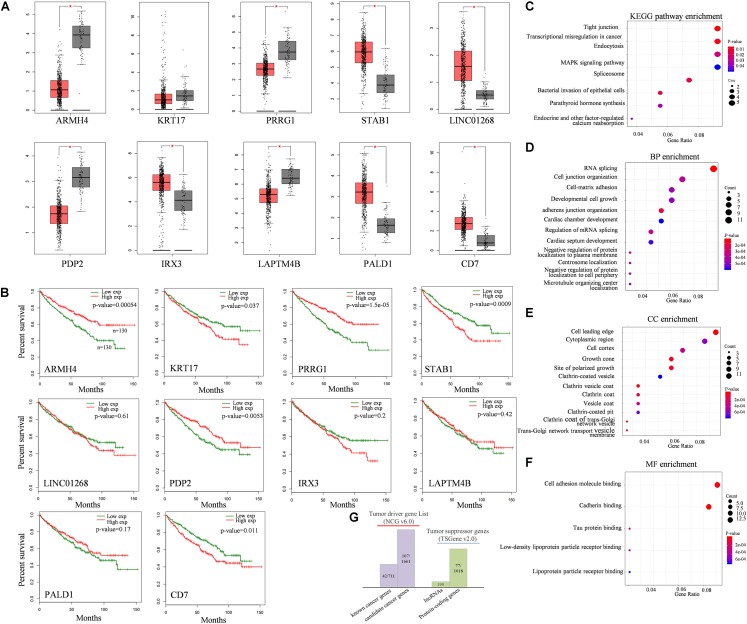
FIGURE 4.
Functional analysis of QKI modulators. (A) Expression levels of top10 modulators in KIRC tumor tissues (red boxes) compared with normal tissues (gray boxes). (B) survival analysis of top10 modulators. The red line means the modulator expression is high, the green line means the modulator is expression low. Modulator is grouped according to the median value of its expression level. (C–F) KEGG pathway and GO enrichment analysis, including biological process (BP), cellular component (CC) and molecular function (MF). (G) Cancer-relevant modulators identification according to Network of Cancer genes (NCG) and Tumor suppressor gene (TSGene) database. (*The top10 modulators were selected based on the number of their influenced splicing targets).

